Fig. 5.
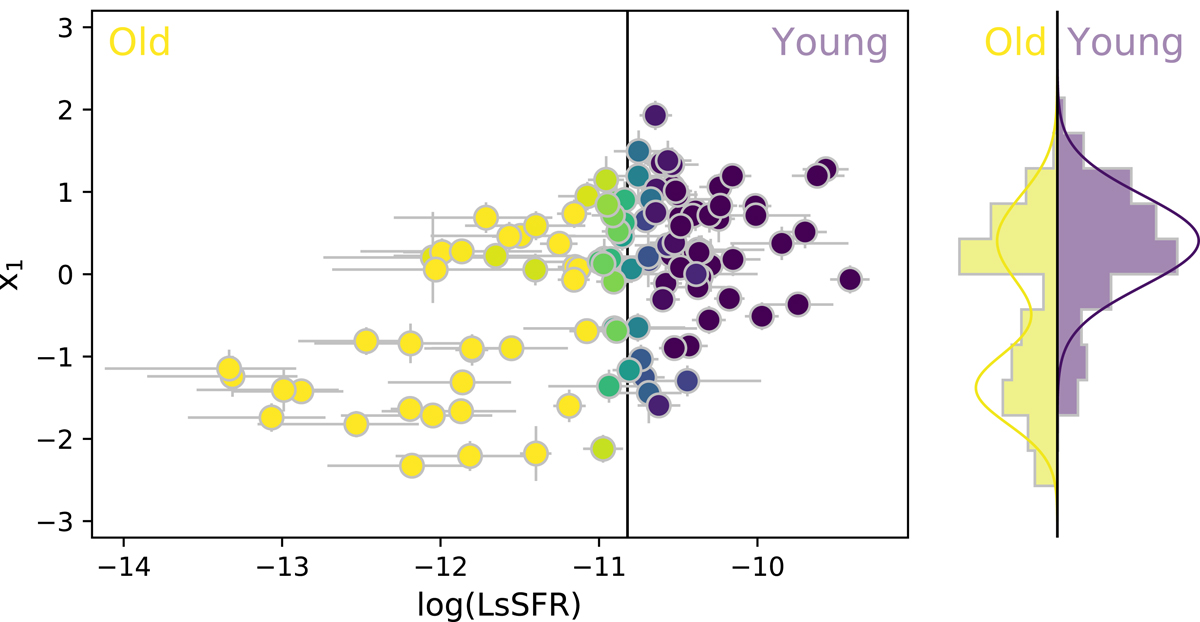
Main: SALT2.4 light-curve stretch (x1) as a function of the LsSFR for SNfactory SNe. The color corresponds to the probability, py, for the SNe Ia to be young, i.e., to have logLsSFR ≥ −10.82 (see Rigault et al. 2020). Right: py-weighted histogram of the SN stretches, as well as the adjusted base model; contributions of the younger and older population are shown in purple and yellow, respectively.
Current usage metrics show cumulative count of Article Views (full-text article views including HTML views, PDF and ePub downloads, according to the available data) and Abstracts Views on Vision4Press platform.
Data correspond to usage on the plateform after 2015. The current usage metrics is available 48-96 hours after online publication and is updated daily on week days.
Initial download of the metrics may take a while.