Fig. 4.
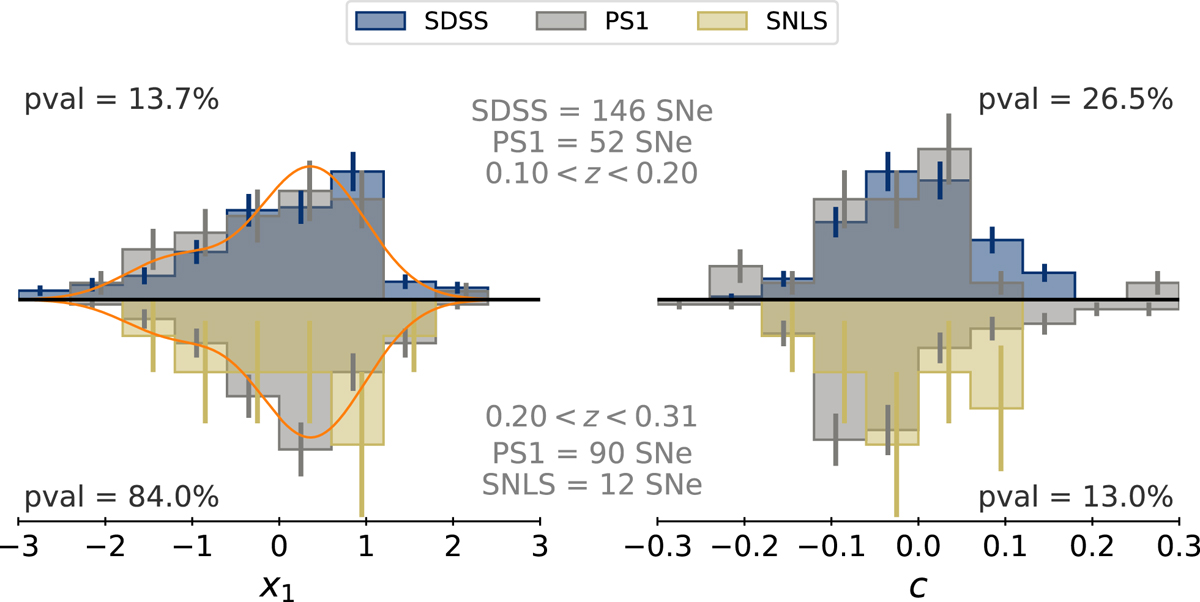
x1 (left) and c (right) distribution histograms of different surveys overlapping in redshift. Facing up: SDSS and PS1 within the redshift range 0.10 < z < 0.20. Facing down: PS1 and SNLS within the redshift range 0.20 < z < 0.31. Error bars show the Poisson noise. Our stretch base model is illustrated in orange at the mean redshift of the redshift ranges, 0.15 and 0.25, respectively. Kolmogorov-Smirnov test p-values are indicated at the top (bottom) of each panel and show no sign that the SDSS and PS1 (PS1 and SNLS) x1 and c distributions are not drawn from the same underlying distributions.
Current usage metrics show cumulative count of Article Views (full-text article views including HTML views, PDF and ePub downloads, according to the available data) and Abstracts Views on Vision4Press platform.
Data correspond to usage on the plateform after 2015. The current usage metrics is available 48-96 hours after online publication and is updated daily on week days.
Initial download of the metrics may take a while.