Fig. 2.
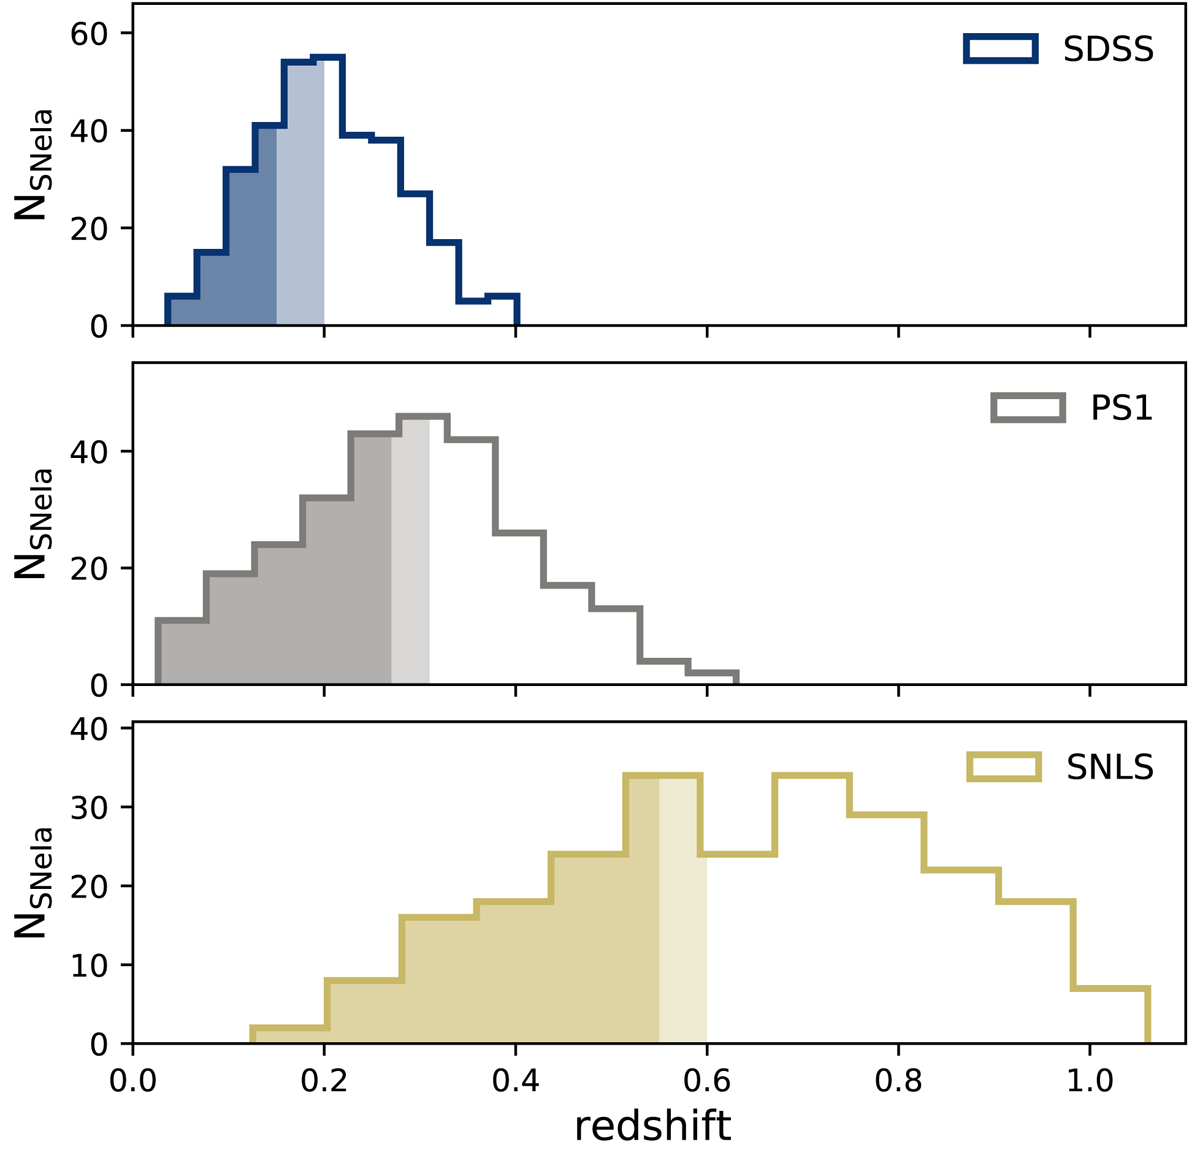
From top to bottom: redshift histograms of SNe Ia from the SDSS, PS1, and SNLS dataset (data from Pantheon, Scolnic et al. 2018). The colored parts represent the distribution of SNe Ia that we retained in our analysis because they are assumed to be free from observational selection bias (see Sect. 2). The darker (lighter) color responds to the conservative (fiducial) selection cut.
Current usage metrics show cumulative count of Article Views (full-text article views including HTML views, PDF and ePub downloads, according to the available data) and Abstracts Views on Vision4Press platform.
Data correspond to usage on the plateform after 2015. The current usage metrics is available 48-96 hours after online publication and is updated daily on week days.
Initial download of the metrics may take a while.