Fig. 1.
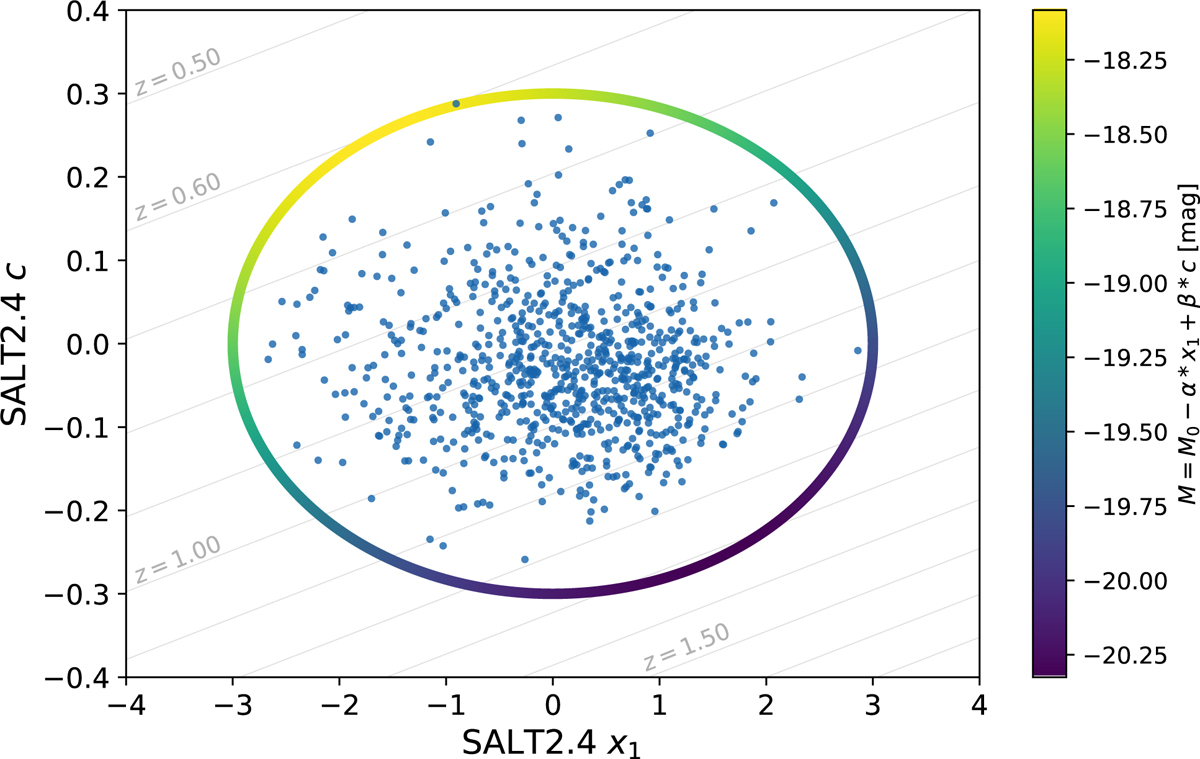
SALT2.4 stretch (x1) and color (c) light-curve parameters of SNe Ia from the SDSS, PS1, and SNLS samples of the Pantheon catalog. The individual SNe are shown as blue dots. The ellipse (x1 = ±3, c = ±0.3) is displayed, colored by the corresponding standardized absolute magnitude using the α and β coefficients from Scolnic et al. (2018). The diagonal gray lines represent the (x1, c) evolution for m = mlim for z between 0.50 and z = 1.70 using the SNLS mlim of 24.8 mag.
Current usage metrics show cumulative count of Article Views (full-text article views including HTML views, PDF and ePub downloads, according to the available data) and Abstracts Views on Vision4Press platform.
Data correspond to usage on the plateform after 2015. The current usage metrics is available 48-96 hours after online publication and is updated daily on week days.
Initial download of the metrics may take a while.