Fig. 1.
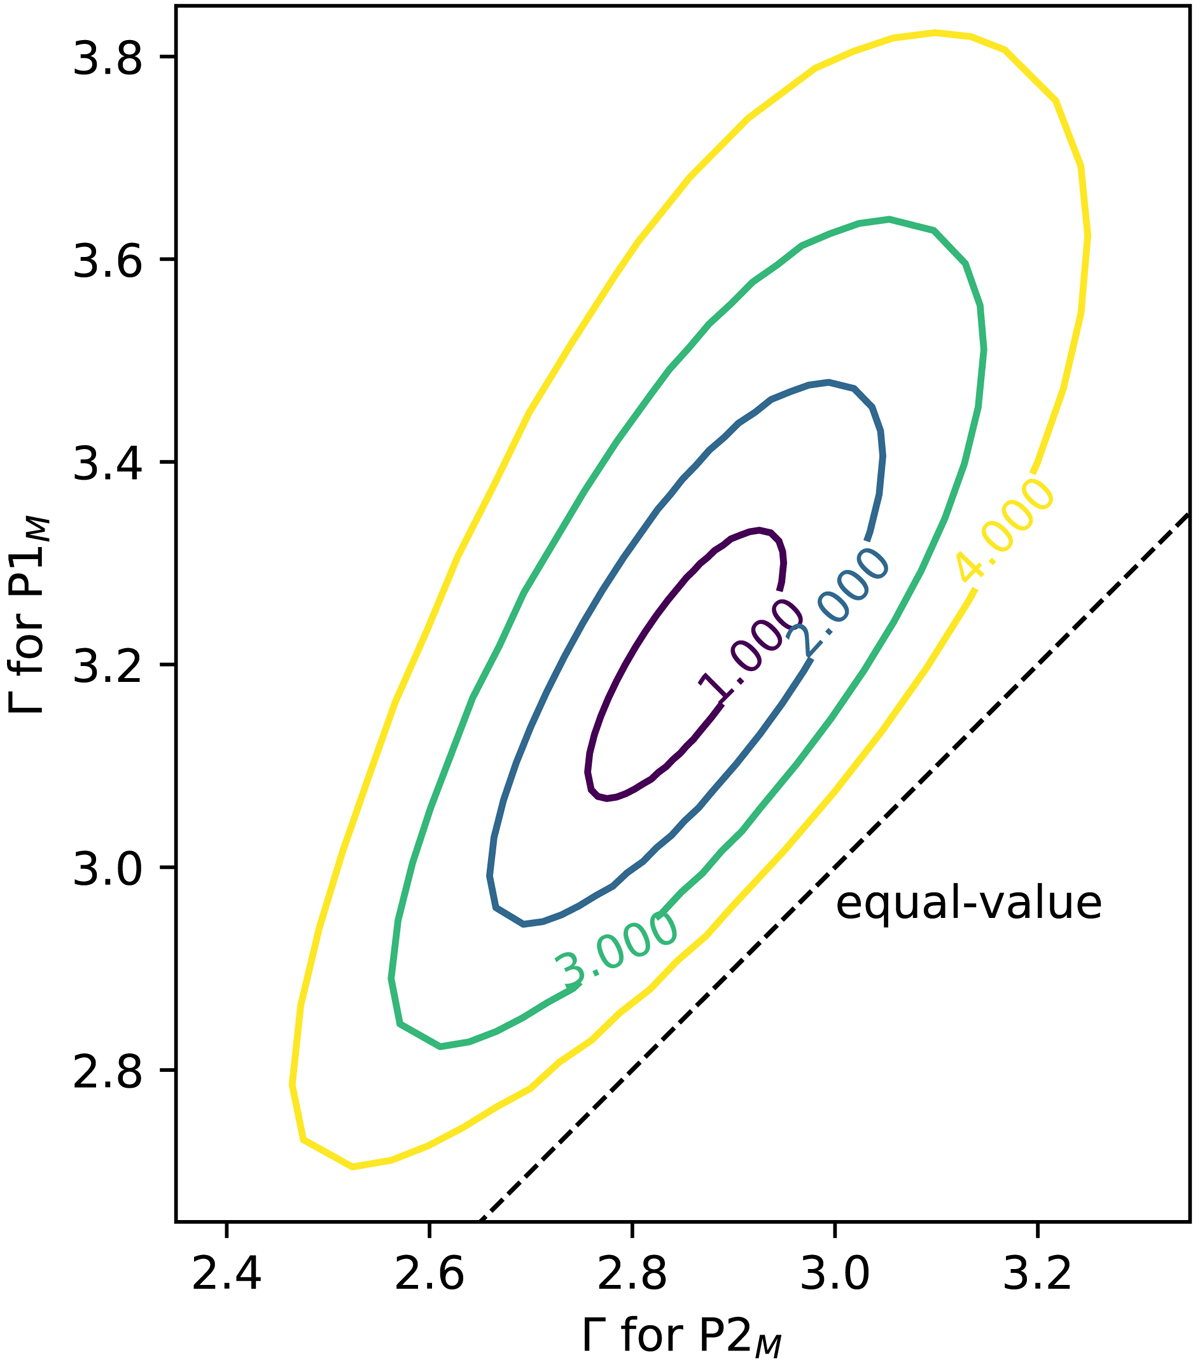
Confidence regions of Γ values for P1M and P2M. The plotted covariance contours respectively correspond to the significance levels of 1σ, 2σ, 3σ, and 4σ (from innermost to outermost). The reference line (which is black, dashed, and straight) indicates the combinations of equal Γ values.
Current usage metrics show cumulative count of Article Views (full-text article views including HTML views, PDF and ePub downloads, according to the available data) and Abstracts Views on Vision4Press platform.
Data correspond to usage on the plateform after 2015. The current usage metrics is available 48-96 hours after online publication and is updated daily on week days.
Initial download of the metrics may take a while.