Fig. 9.
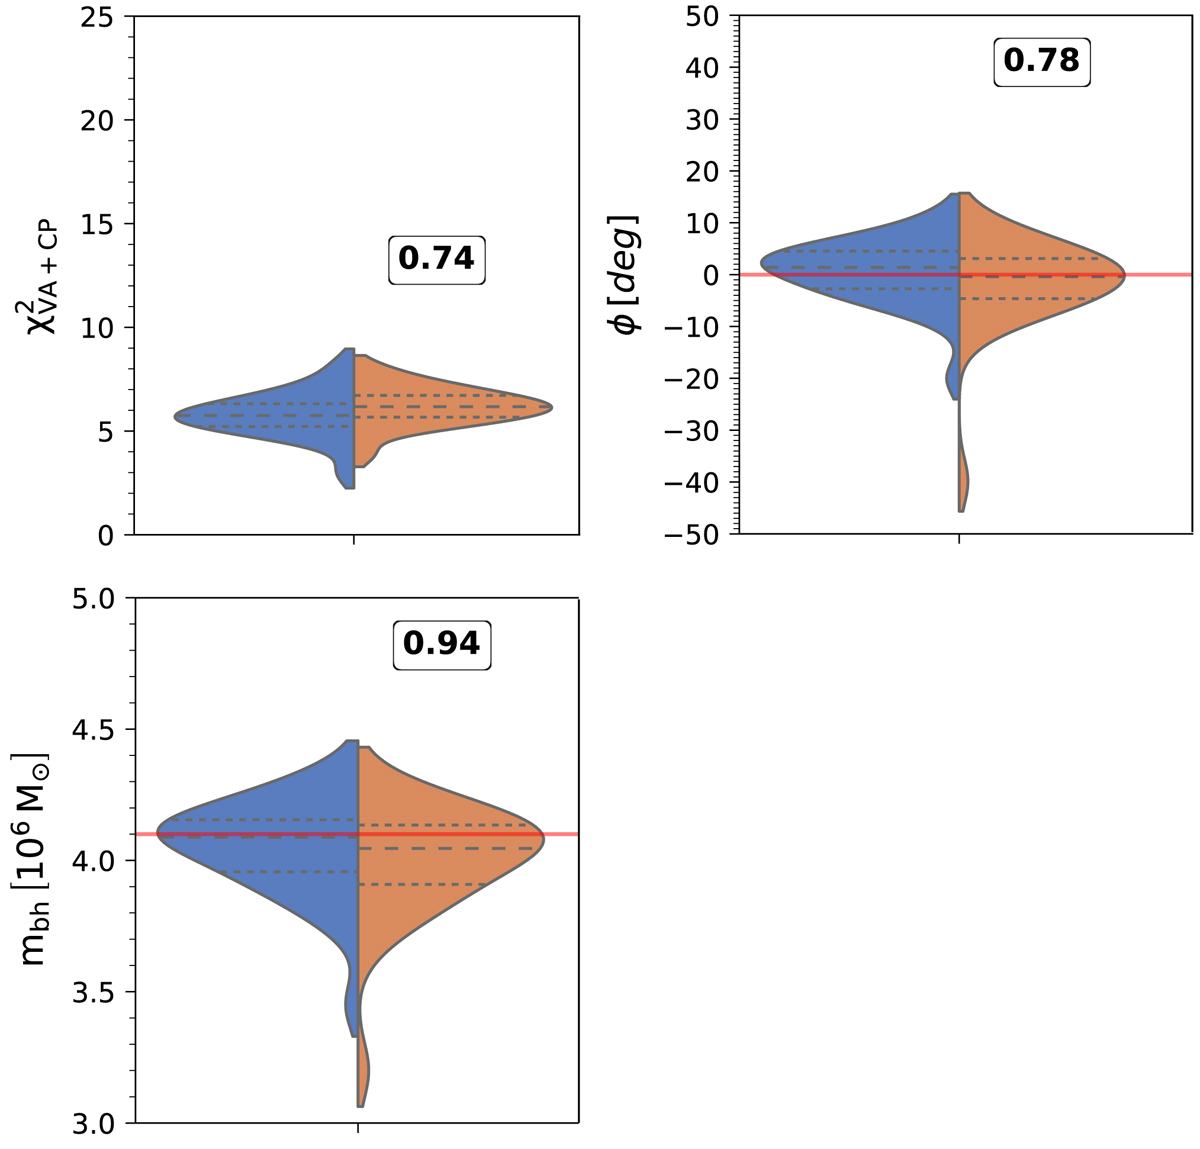
Results for the Kerr a* = 0.6–dilaton black hole test with varying black hole mass. The panels show the distribution of the total ![]() (top left), the position angle, ϕ (top right), and the black hole mass (bottom). In each violin, the left-hand side corresponds to
(top left), the position angle, ϕ (top right), and the black hole mass (bottom). In each violin, the left-hand side corresponds to ![]() and the right-hand side corresponds to
and the right-hand side corresponds to ![]() . The numbers above the violins indicate the results of the two-sided K–S test. The red line in the middle and right panel corresponds to the initial position angle ϕ = 0 and initial black hole mass Mbh = 4.14 × 10⁶ M⊙ used for the GRRT images.
. The numbers above the violins indicate the results of the two-sided K–S test. The red line in the middle and right panel corresponds to the initial position angle ϕ = 0 and initial black hole mass Mbh = 4.14 × 10⁶ M⊙ used for the GRRT images.
Current usage metrics show cumulative count of Article Views (full-text article views including HTML views, PDF and ePub downloads, according to the available data) and Abstracts Views on Vision4Press platform.
Data correspond to usage on the plateform after 2015. The current usage metrics is available 48-96 hours after online publication and is updated daily on week days.
Initial download of the metrics may take a while.