Fig. 2.
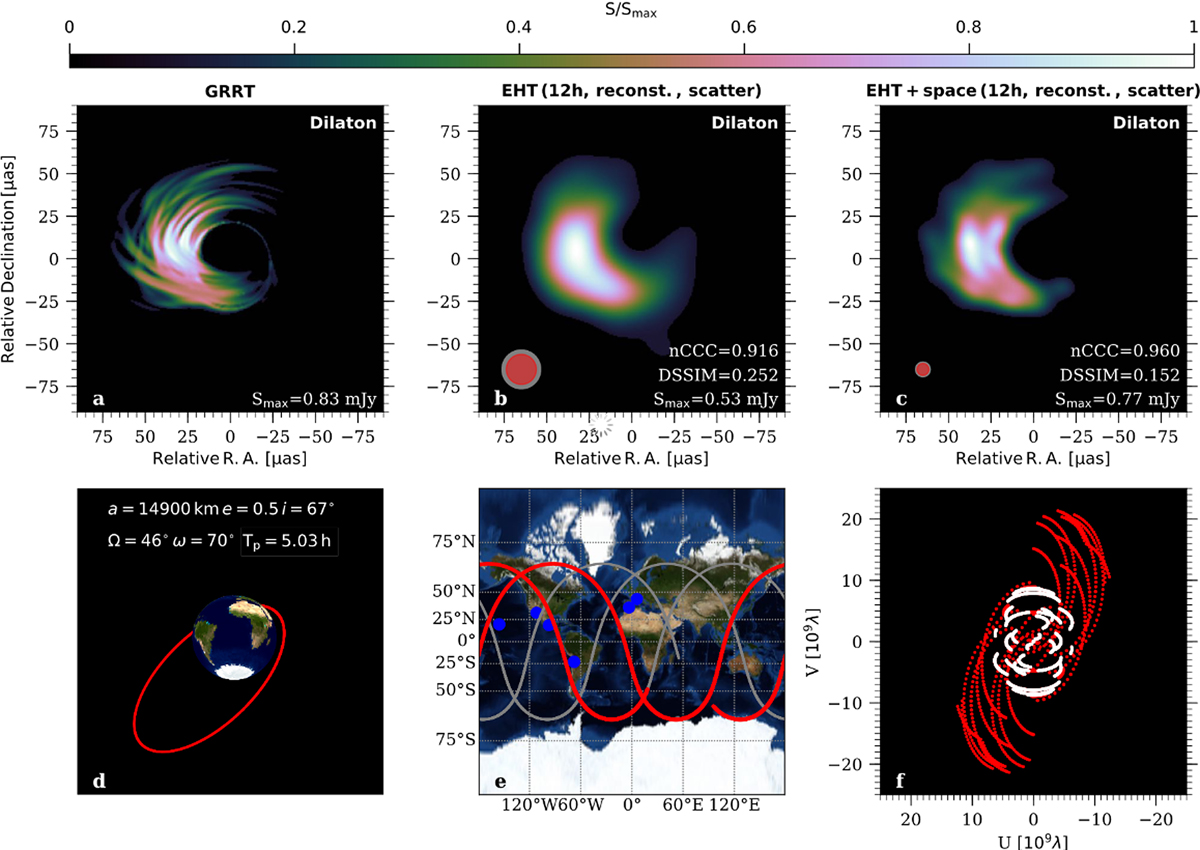
Result of the orbit optimisation for 12 h of Sgr A* observations. Top row, from left to right: GRRT image (panel a), reconstructed image with interstellar scattering (including both diffractive and refractive scattering during the generation of the synthetic visibilities) using the EHT 2017 configuration convolved with 75% (red shading) of the nominal array resolution (light grey shading, panel b) and reconstructed image with interstellar scattering (including both diffractive and refractive scattering during the generation of the synthetic visibilities) using the space-EHT configuration convolved with 75% (red shading) of the nominal array resolution (light grey shading, panel c) for a dilaton black hole. Bottom row, from left to right: satellite orbit as seen from Sgr A* with orbital parameters and orbital period (panel d), satellite ground track (red lines for 12 h and grey ones for 24 h), ground array antennas (blue points, panel e), u − v sampling for the ground array (white points), and the baselines including the space antenna (red points, panel f).
Current usage metrics show cumulative count of Article Views (full-text article views including HTML views, PDF and ePub downloads, according to the available data) and Abstracts Views on Vision4Press platform.
Data correspond to usage on the plateform after 2015. The current usage metrics is available 48-96 hours after online publication and is updated daily on week days.
Initial download of the metrics may take a while.