Free Access
Fig. C.3.
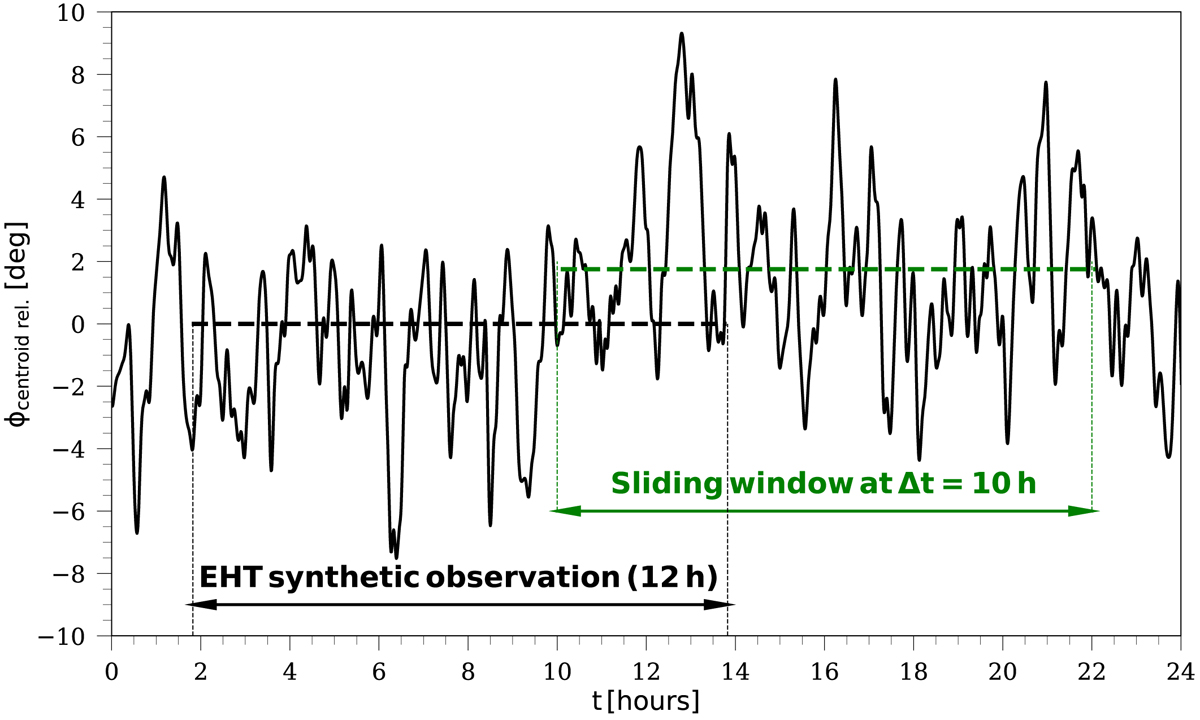
Variation of the image centroid position angle relative to the one from the sliding window used for the generation of the synthetic data (indicated by the black arrow). The mean centroid position angle for a second sliding window with a 10 h offset is indicated in green.
Current usage metrics show cumulative count of Article Views (full-text article views including HTML views, PDF and ePub downloads, according to the available data) and Abstracts Views on Vision4Press platform.
Data correspond to usage on the plateform after 2015. The current usage metrics is available 48-96 hours after online publication and is updated daily on week days.
Initial download of the metrics may take a while.