Fig. 1.
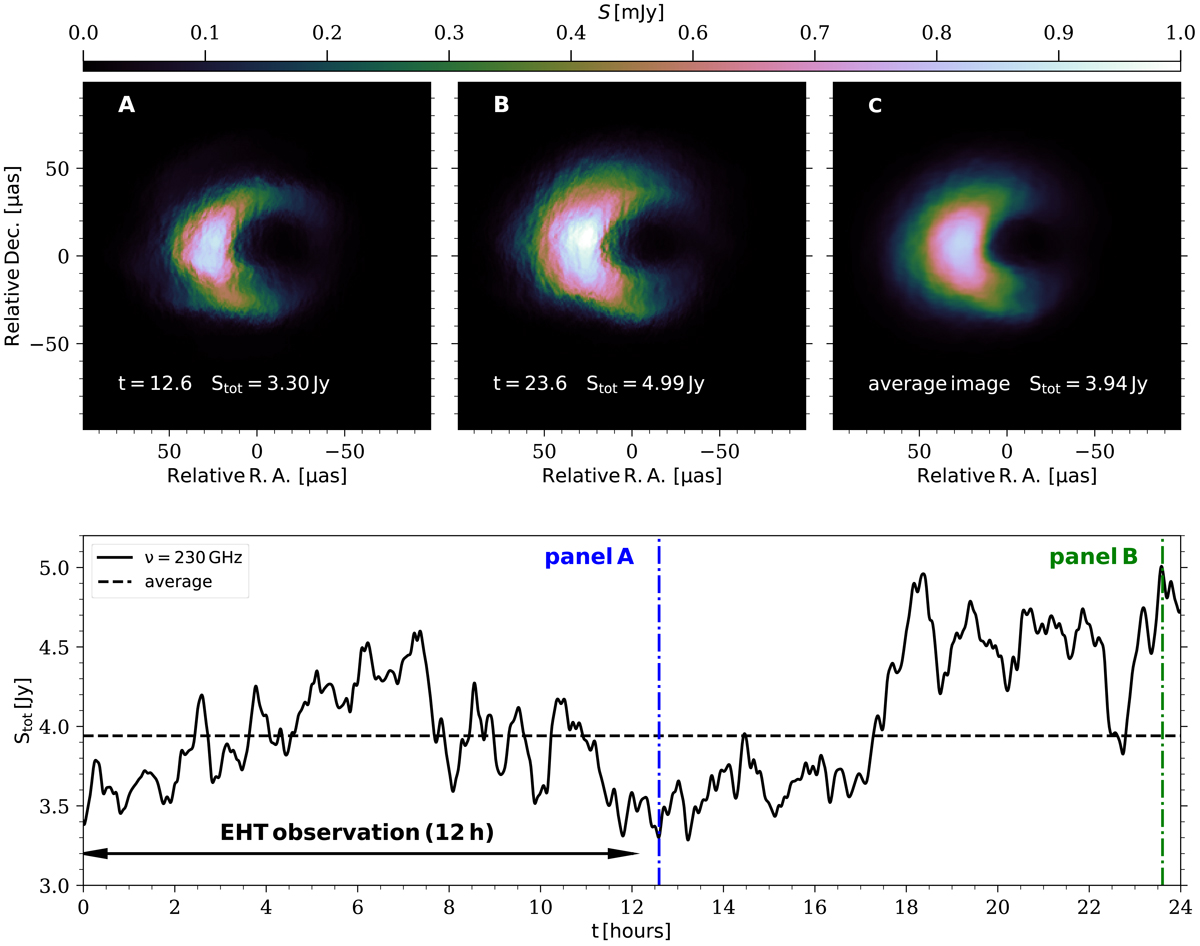
Top, panels A and B: GRRT images for a Kerr black hole with a* = 0.6 including scattering effects (diffractive and refractive scattering) for two selected times t = 12.6 h and t = 23.6 h (dash-dotted line in the bottom panel) at a frequency of 230 GHz. The average image for 24 h of observation is presented in panel C. Bottom: simulated total flux light curve at 230 GHz for 24 h of observations. A typical EHT observation with a duration of 12 h is indicated.
Current usage metrics show cumulative count of Article Views (full-text article views including HTML views, PDF and ePub downloads, according to the available data) and Abstracts Views on Vision4Press platform.
Data correspond to usage on the plateform after 2015. The current usage metrics is available 48-96 hours after online publication and is updated daily on week days.
Initial download of the metrics may take a while.