Fig. 8.
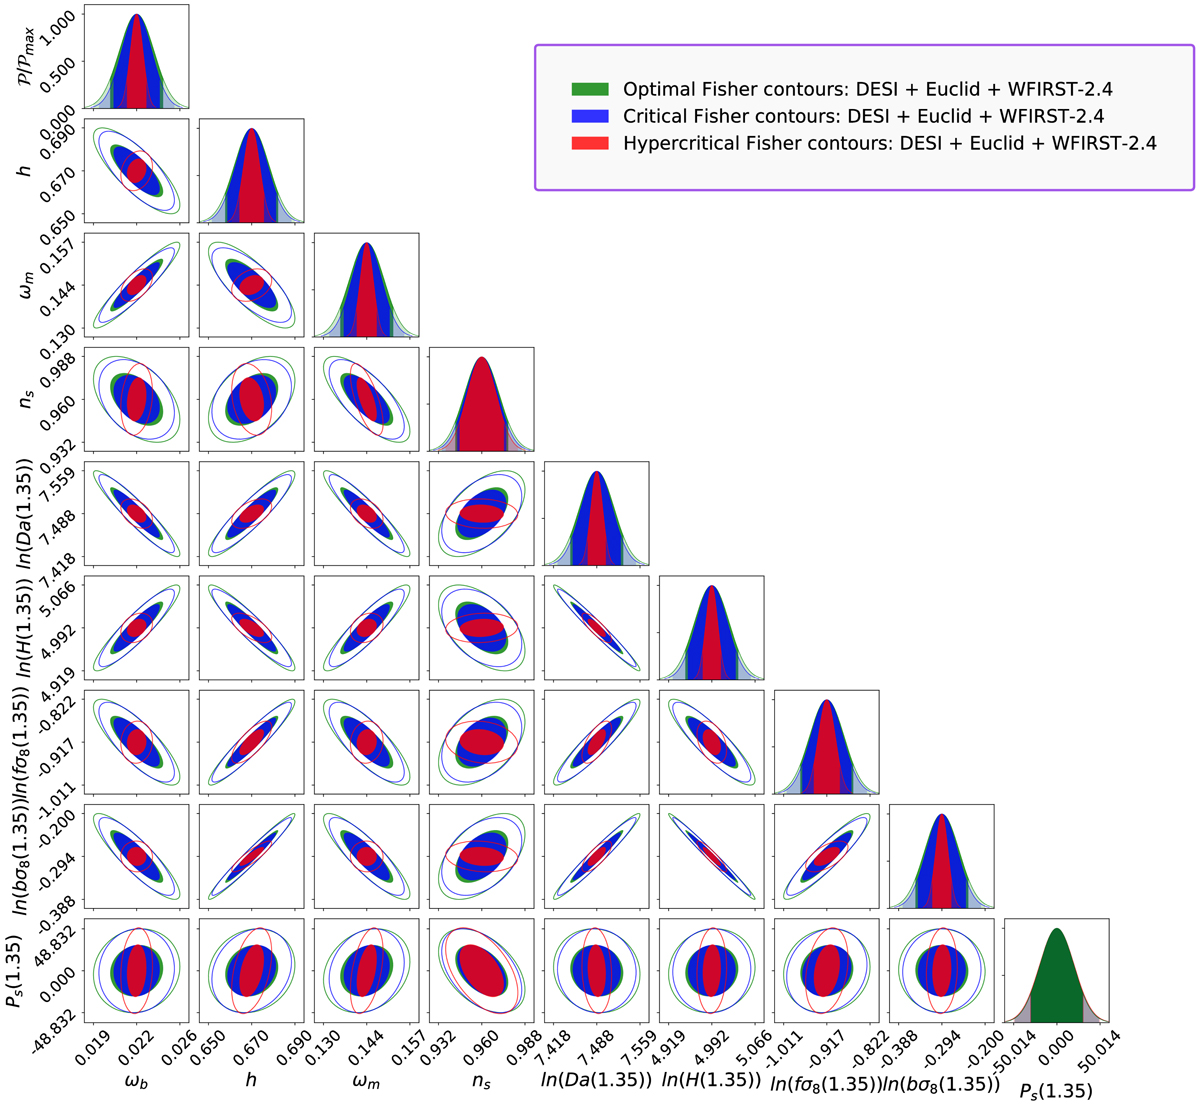
Fisher contours: M2 approach, for the optimal (green), critical (blue), and hypercritical (red) steps. In this case, the use of critical step size leads to contours close the ones obtained with the optimal step size, while the hypercritical (twice the critical one) leads most of the contours to be incorrect, as well as most of the 1D likelihood.
Current usage metrics show cumulative count of Article Views (full-text article views including HTML views, PDF and ePub downloads, according to the available data) and Abstracts Views on Vision4Press platform.
Data correspond to usage on the plateform after 2015. The current usage metrics is available 48-96 hours after online publication and is updated daily on week days.
Initial download of the metrics may take a while.