Open Access
Fig. 6.
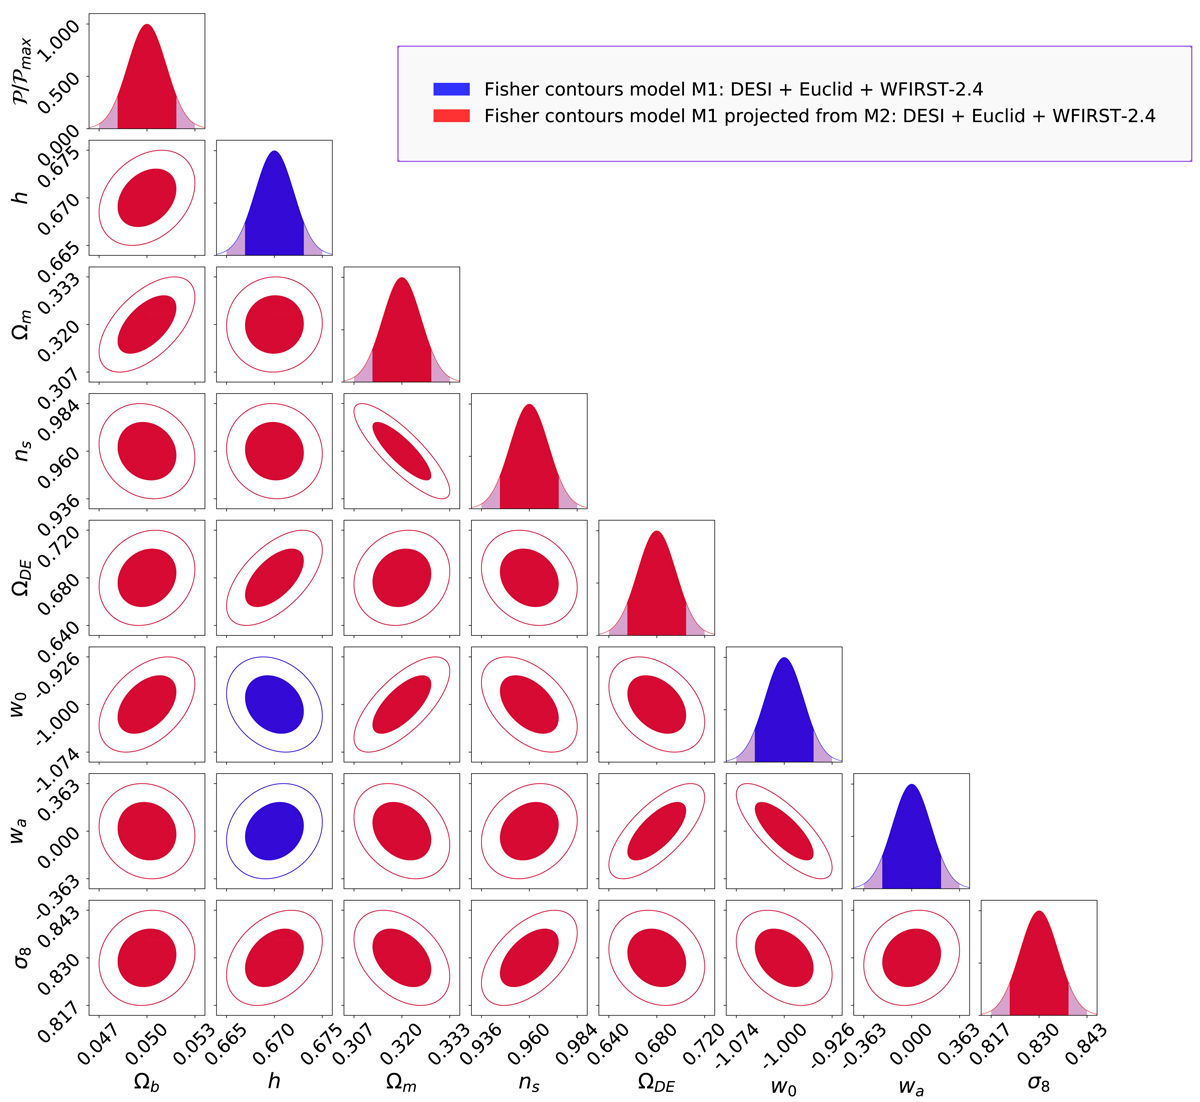
Fisher approach M1 (blue) contours with optimal step sizes vs. Fisher approach M1 (red) with optimal step sizes contours projected from the model M2. Smaller contours are set in front. Here, the contours are nearly identical, with minor numerical differences putting one contour in front of the other nearly randomly.
Current usage metrics show cumulative count of Article Views (full-text article views including HTML views, PDF and ePub downloads, according to the available data) and Abstracts Views on Vision4Press platform.
Data correspond to usage on the plateform after 2015. The current usage metrics is available 48-96 hours after online publication and is updated daily on week days.
Initial download of the metrics may take a while.