Open Access
Fig. 9
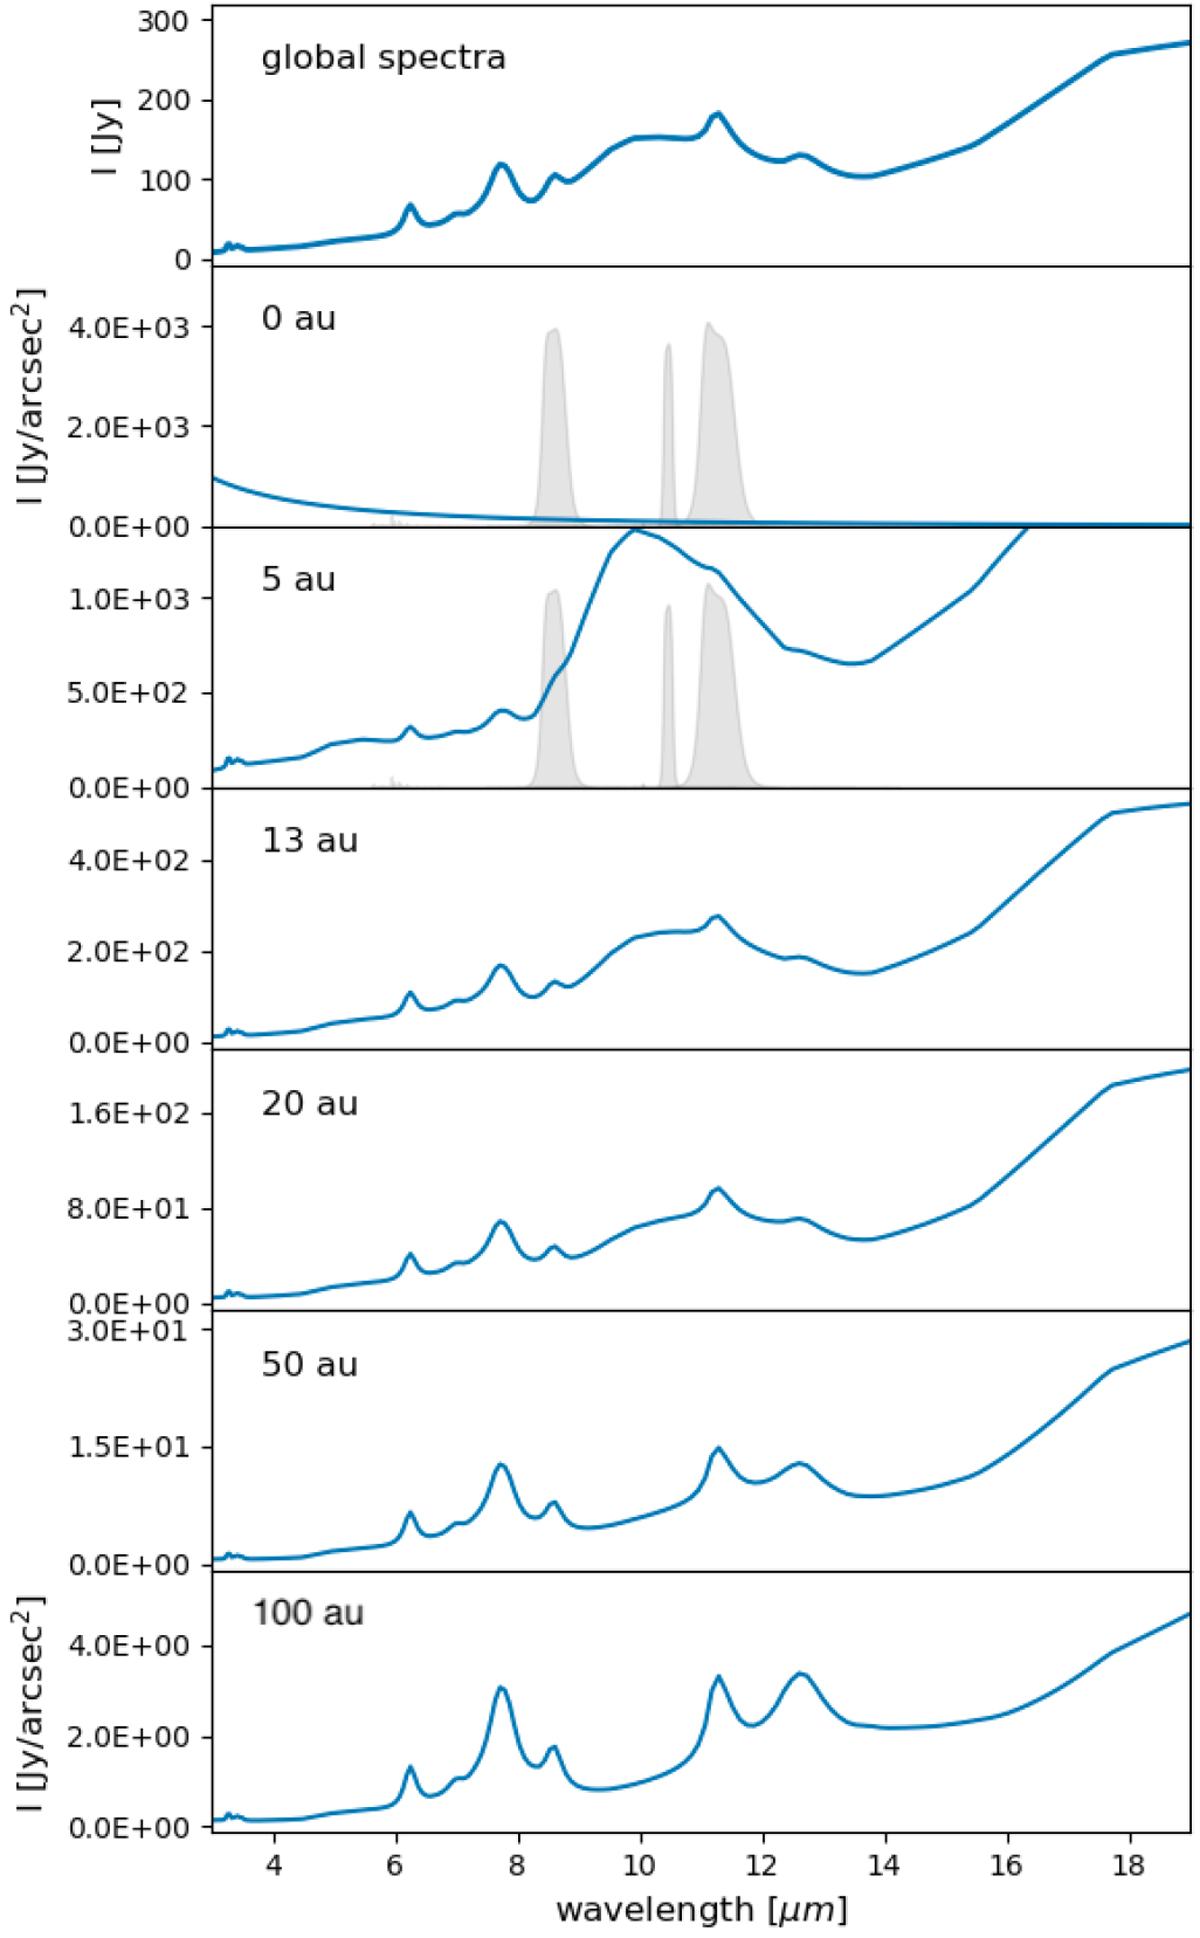
IR emission POLARIS spectra between 3 and 20 μm. Global (Jy) (top panel) and individual emission spectra (Jy arcsec−2) are plotted from 1 au (second panel) to 100 au (bottom) from the star. VISIR filters are also plotted (grey).
Current usage metrics show cumulative count of Article Views (full-text article views including HTML views, PDF and ePub downloads, according to the available data) and Abstracts Views on Vision4Press platform.
Data correspond to usage on the plateform after 2015. The current usage metrics is available 48-96 hours after online publication and is updated daily on week days.
Initial download of the metrics may take a while.