Fig. 8
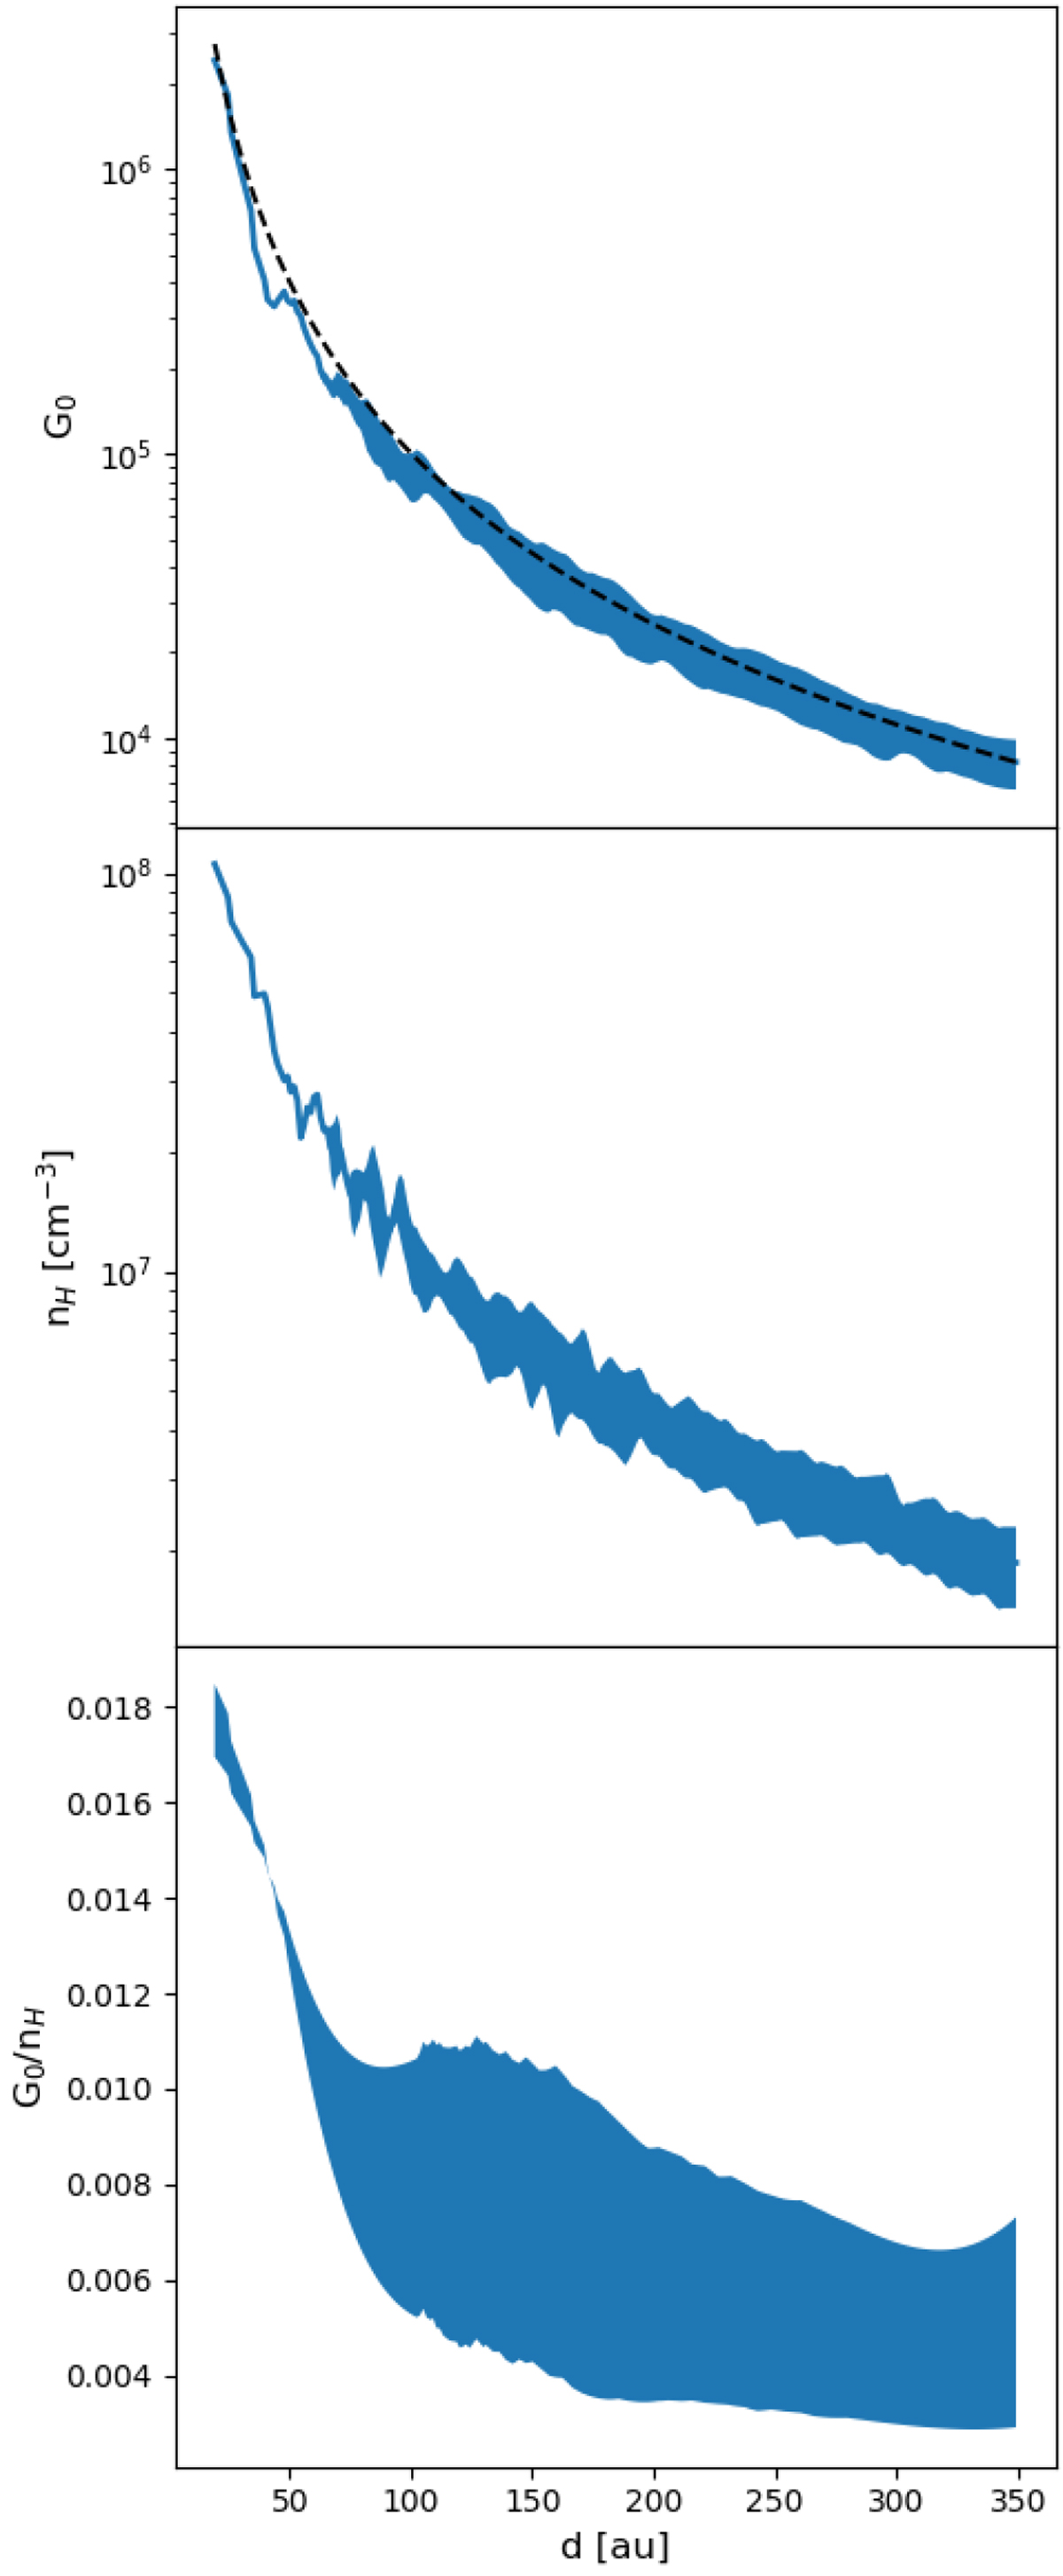
G0, nH, and G0 ∕nH according to distances to the star for the model. G0 is the average of G0 values between 25 and 75% of the total emission at 3.3 μm seen by the observer (Fig. 7, top panel). Idem for nH (middle panel) and G0/nH (bottom panel). The width of the line is for the standard dispersion of the values. 1∕d2 (dotted black line) is also plotted in the top panel.
Current usage metrics show cumulative count of Article Views (full-text article views including HTML views, PDF and ePub downloads, according to the available data) and Abstracts Views on Vision4Press platform.
Data correspond to usage on the plateform after 2015. The current usage metrics is available 48-96 hours after online publication and is updated daily on week days.
Initial download of the metrics may take a while.