Fig. 7
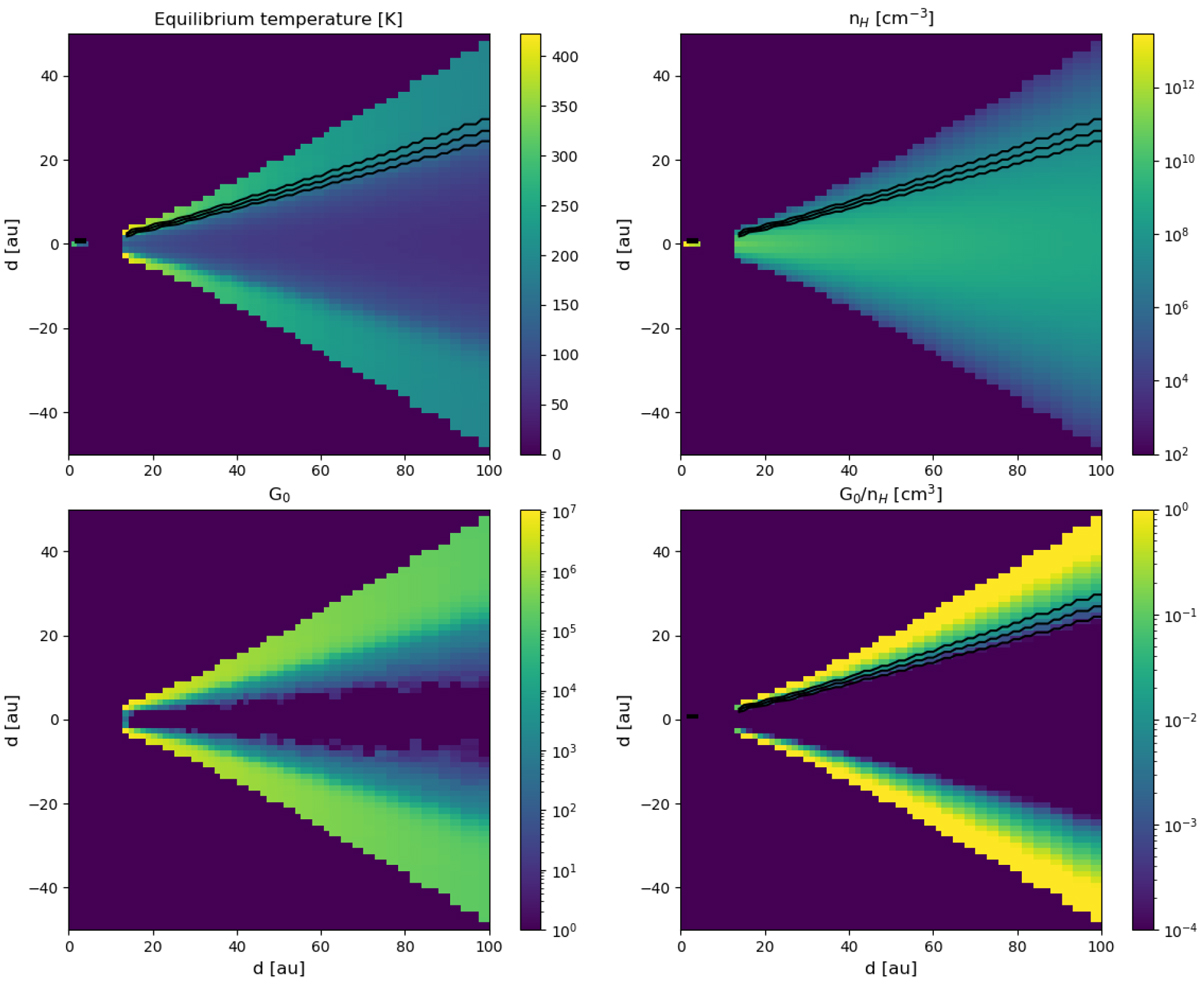
Vertical cuts through the model disk from our POLARIS simulation. The cuts show the temperature (K) distribution of large a-C(:H)/a-C at thermal equilibrium (top left), the hydrogen density nH (cm−3) distribution (top right), the radiation field intensity G0 (bottom left), and the G0∕nH (cm3) ratio (bottom right) of the two previous maps. The black lines correspond to 25, 50, and 75% of the total emission at 3.3 μm seen from the top. The white area in the two lower panels arises because G0 is not defined in the most median parts of the disk because UV radiation does not penetrate them.
Current usage metrics show cumulative count of Article Views (full-text article views including HTML views, PDF and ePub downloads, according to the available data) and Abstracts Views on Vision4Press platform.
Data correspond to usage on the plateform after 2015. The current usage metrics is available 48-96 hours after online publication and is updated daily on week days.
Initial download of the metrics may take a while.