Fig. 6
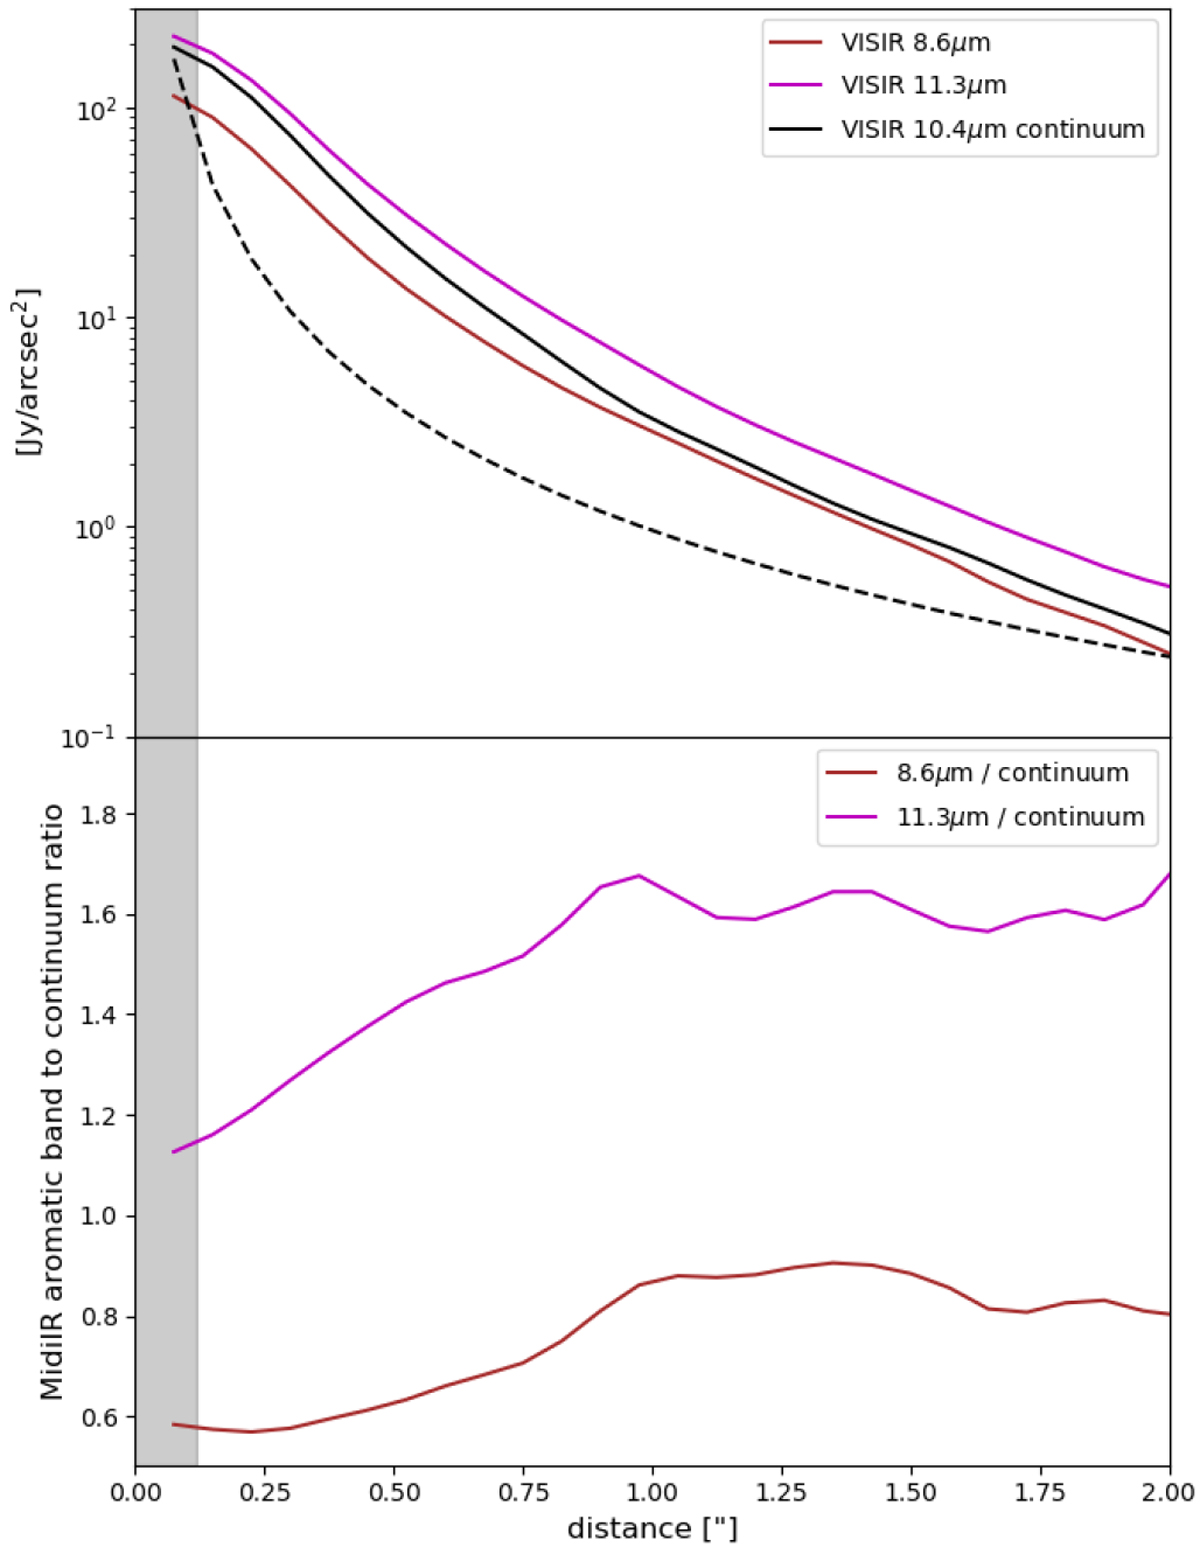
Top panel: 8.6 μm (brown) and 11.3 μm (magenta) aromatic emission bands and 10.4 μm (black) continuum emission plotted according to the distance to the star. The 1∕d2 function is also plotted (black dotted). Bottom panel: 8.6 μm/10.4 μm and 11.3 μm/10.4 μm band ratios plotted according the distance to the star. The transparent grey box on the left represents the distance up to which the cavity is extended in POLARIS simulations, ~ 0.12′′ (13 au). At large distances, the variations in the band-to-continuum ratios are not significant. The error bars on the band-to-continuum ratio are about 5%.
Current usage metrics show cumulative count of Article Views (full-text article views including HTML views, PDF and ePub downloads, according to the available data) and Abstracts Views on Vision4Press platform.
Data correspond to usage on the plateform after 2015. The current usage metrics is available 48-96 hours after online publication and is updated daily on week days.
Initial download of the metrics may take a while.