Fig. 4
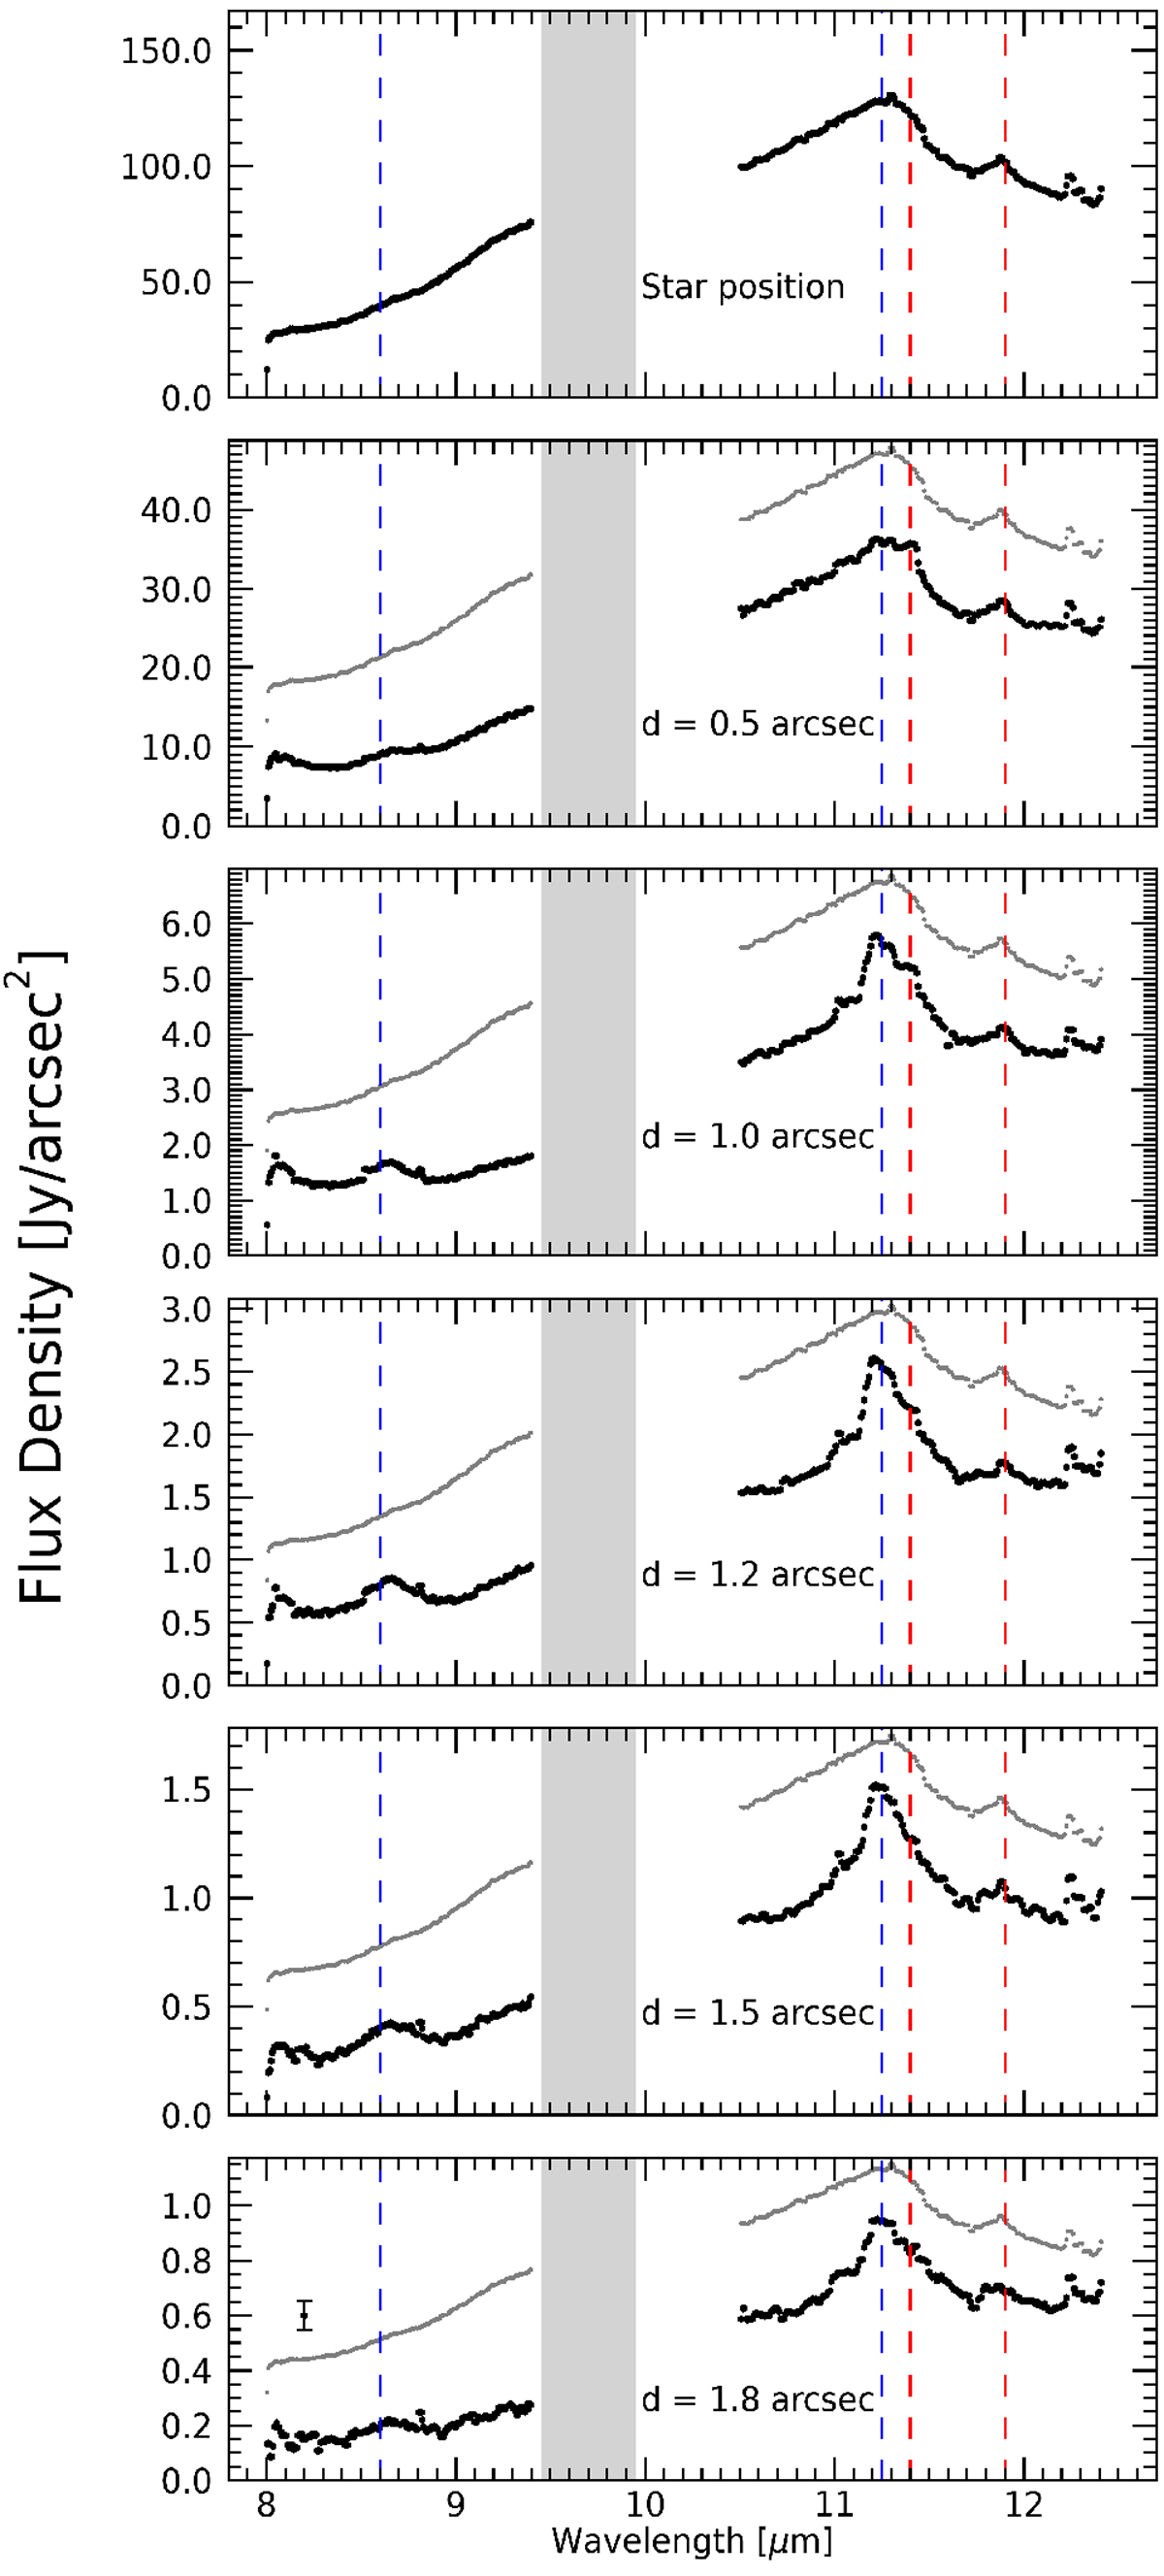
VISIR observed spectra in HD 100546 extracted at different angular distances (0, 0.5, 1.0, 1.2, 1.5, and 1.8″). The grey region delimits the telluric ozone absorption feature. The corresponding grating set-up has not been recorded at that position because of the usual poor quality of the data. A rescaled or offset star position spectrum is repeated (light grey) in all panels to serve as a reference. The positions of the aromatic (blue) andcrystalline forsterite (red) main features in VISIR observation range are overplotted. The typical ± 3σ error derived from background noise is shown in the lower panel.
Current usage metrics show cumulative count of Article Views (full-text article views including HTML views, PDF and ePub downloads, according to the available data) and Abstracts Views on Vision4Press platform.
Data correspond to usage on the plateform after 2015. The current usage metrics is available 48-96 hours after online publication and is updated daily on week days.
Initial download of the metrics may take a while.