Open Access
Fig. A.1
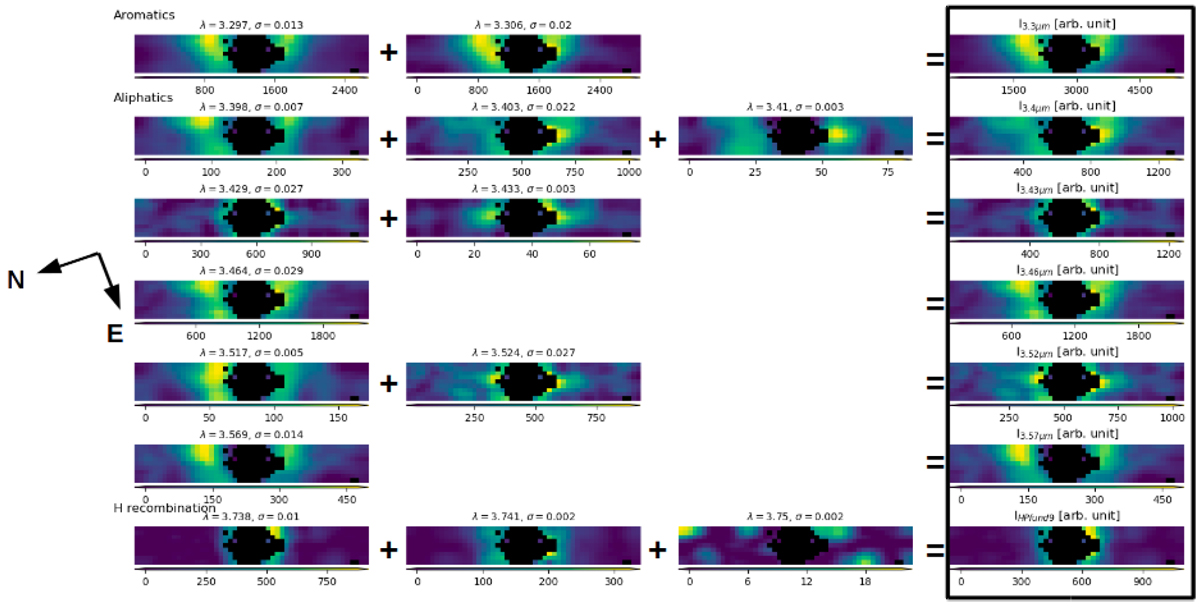
Main feature maps from the ROHSA decomposition of NaCo data. The last column is the sum of the first columns. Figure 2 showed that several Gaussians are sometimes needed to reproduce the features.
Current usage metrics show cumulative count of Article Views (full-text article views including HTML views, PDF and ePub downloads, according to the available data) and Abstracts Views on Vision4Press platform.
Data correspond to usage on the plateform after 2015. The current usage metrics is available 48-96 hours after online publication and is updated daily on week days.
Initial download of the metrics may take a while.