Open Access
Fig. 14
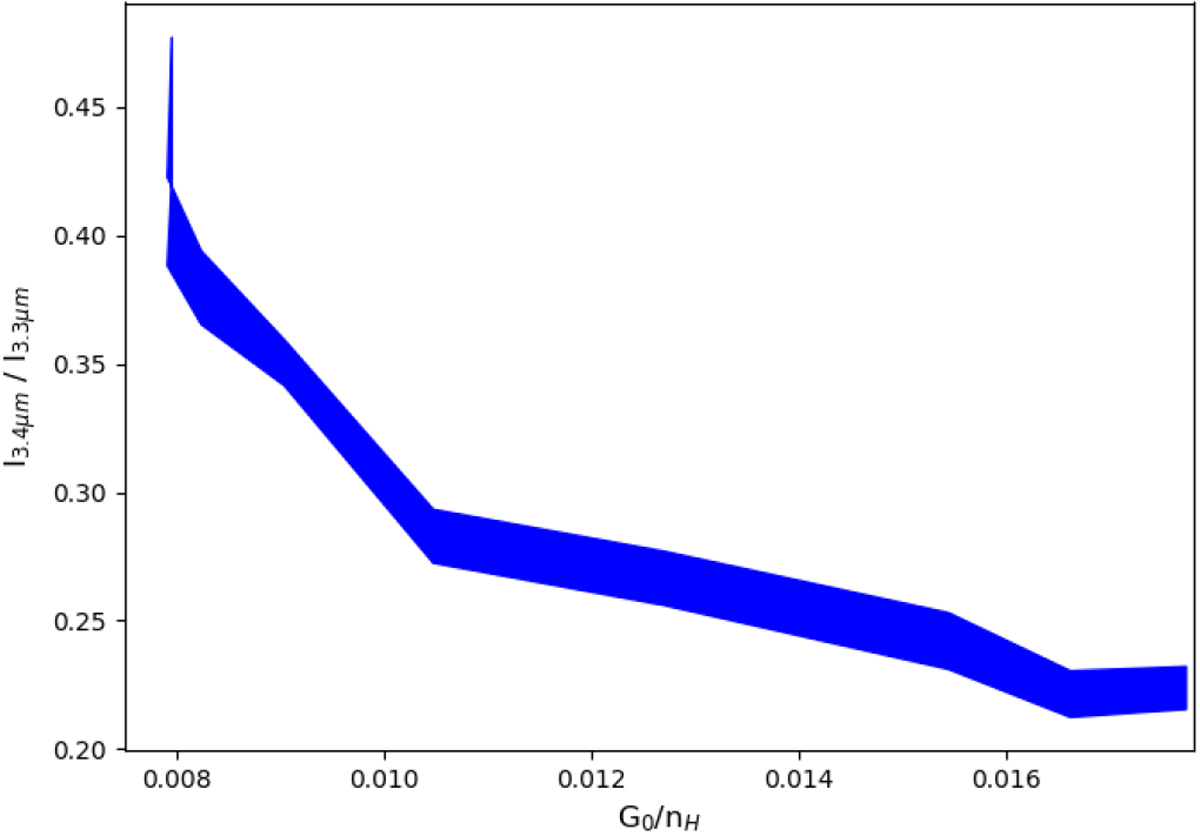
Spatial profile of the aliphatic-to-aromatic band ratio, I3.4 μm∕I3.3 μm, according to the G0∕nH ratio calculated with POLARIS in the disk surface zone from which most of the band emission originates. The highest values of G0∕nH correspond to the regions closest to the star.
Current usage metrics show cumulative count of Article Views (full-text article views including HTML views, PDF and ePub downloads, according to the available data) and Abstracts Views on Vision4Press platform.
Data correspond to usage on the plateform after 2015. The current usage metrics is available 48-96 hours after online publication and is updated daily on week days.
Initial download of the metrics may take a while.