Fig. 13
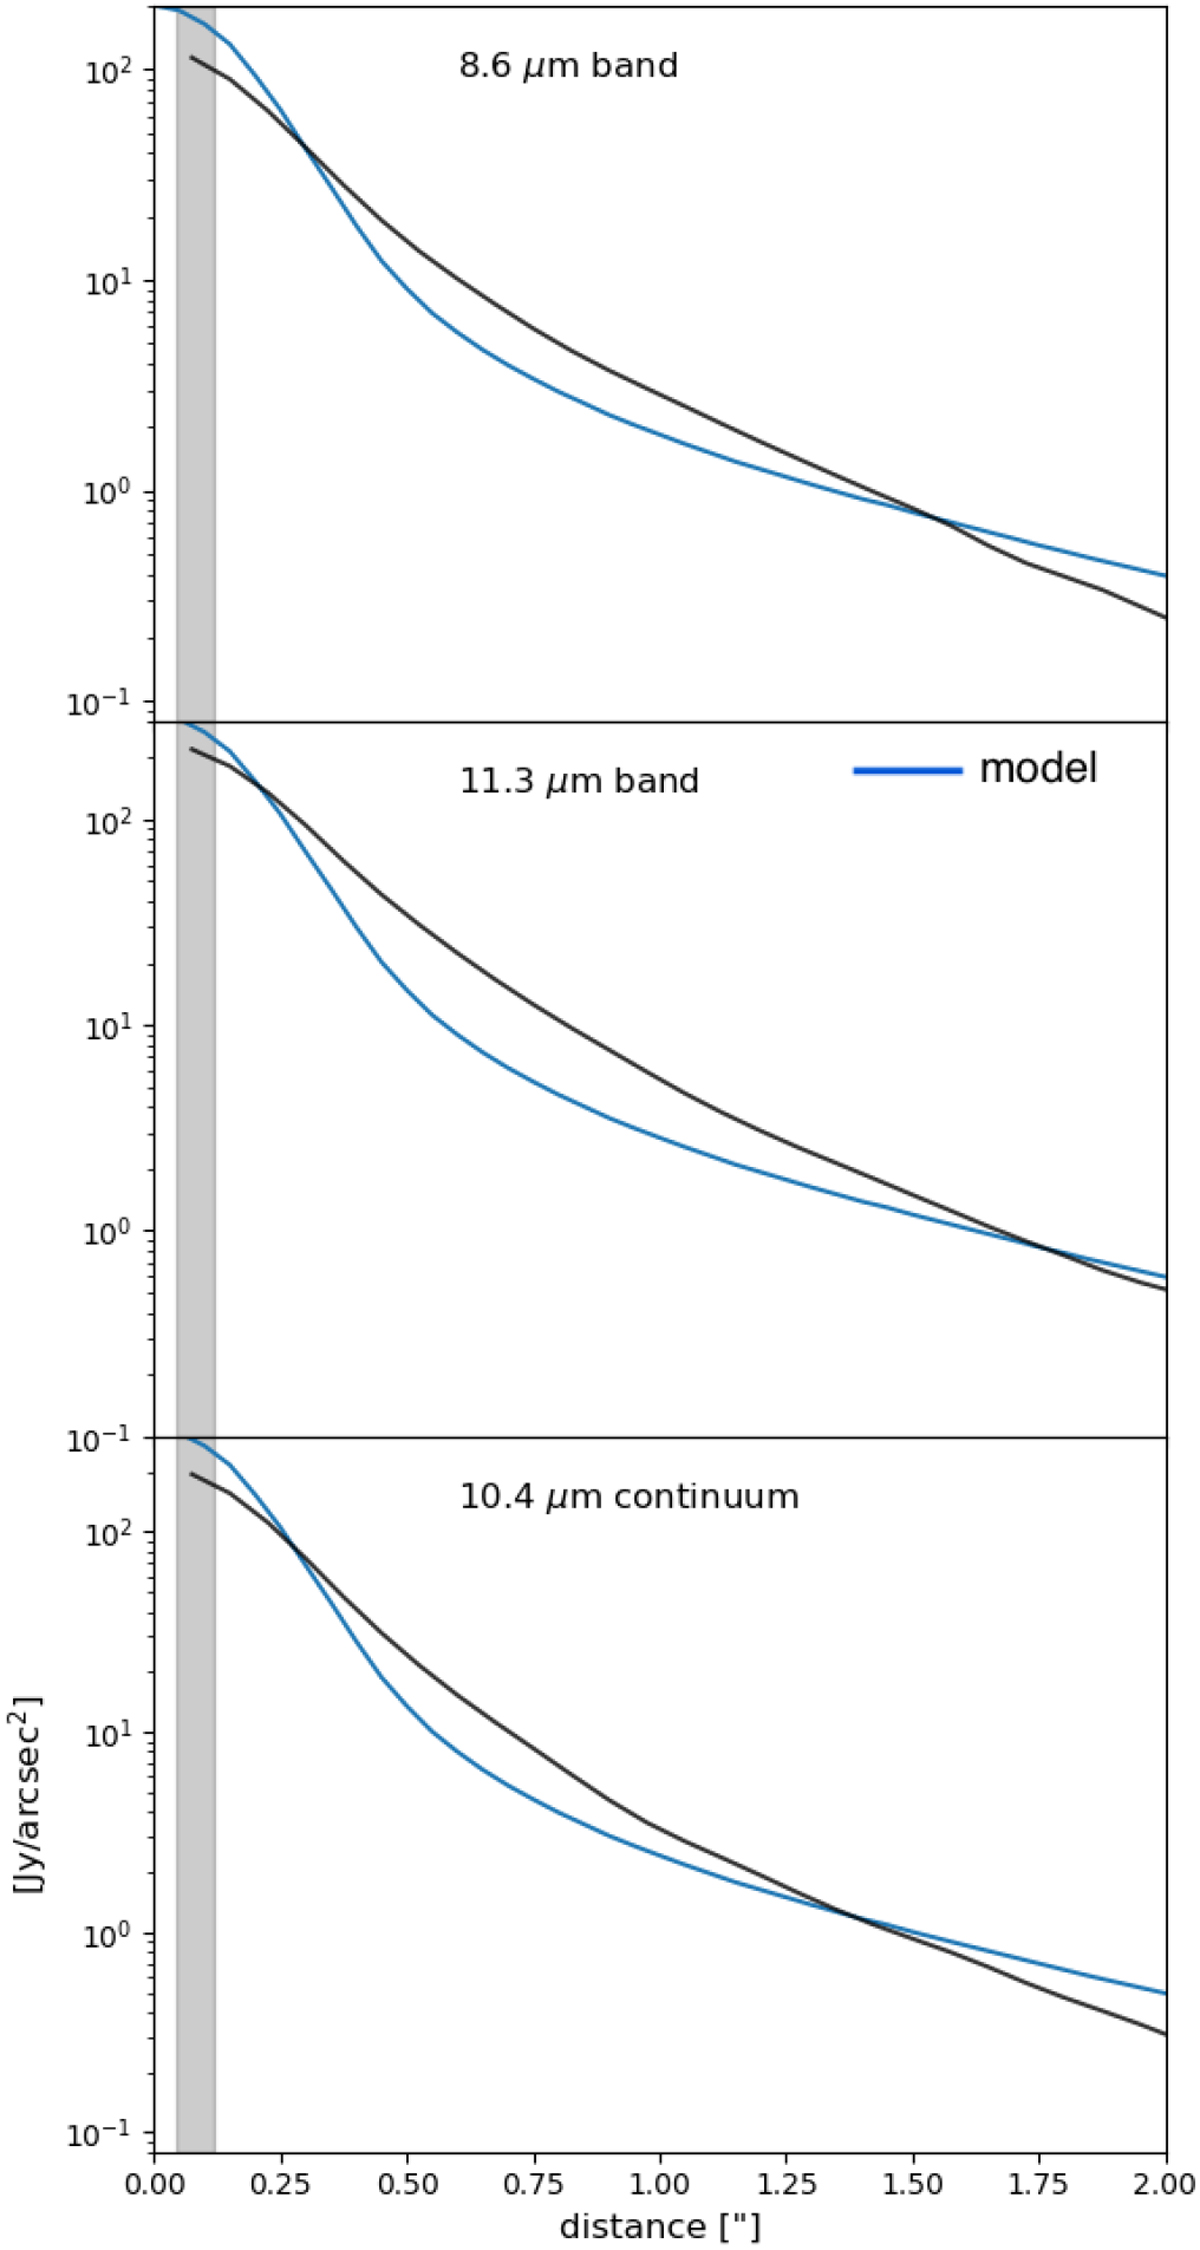
8.6 μm (top panel), 11.3 μm (middle panel), and 10.4 μm (bottom panel) VISIR bands (grey) vs. the model. The predicted profiles were convolved with a Gaussian of 0.3′′ similar to the spatial resolution ofVISIR and integrated using VISIR filters to compare to the observations. The transparent grey box on the left represents the distance up to which the cavity is extended in the POLARIS simulations: ~ 0.12′′ (13 au).
Current usage metrics show cumulative count of Article Views (full-text article views including HTML views, PDF and ePub downloads, according to the available data) and Abstracts Views on Vision4Press platform.
Data correspond to usage on the plateform after 2015. The current usage metrics is available 48-96 hours after online publication and is updated daily on week days.
Initial download of the metrics may take a while.