Fig. 12
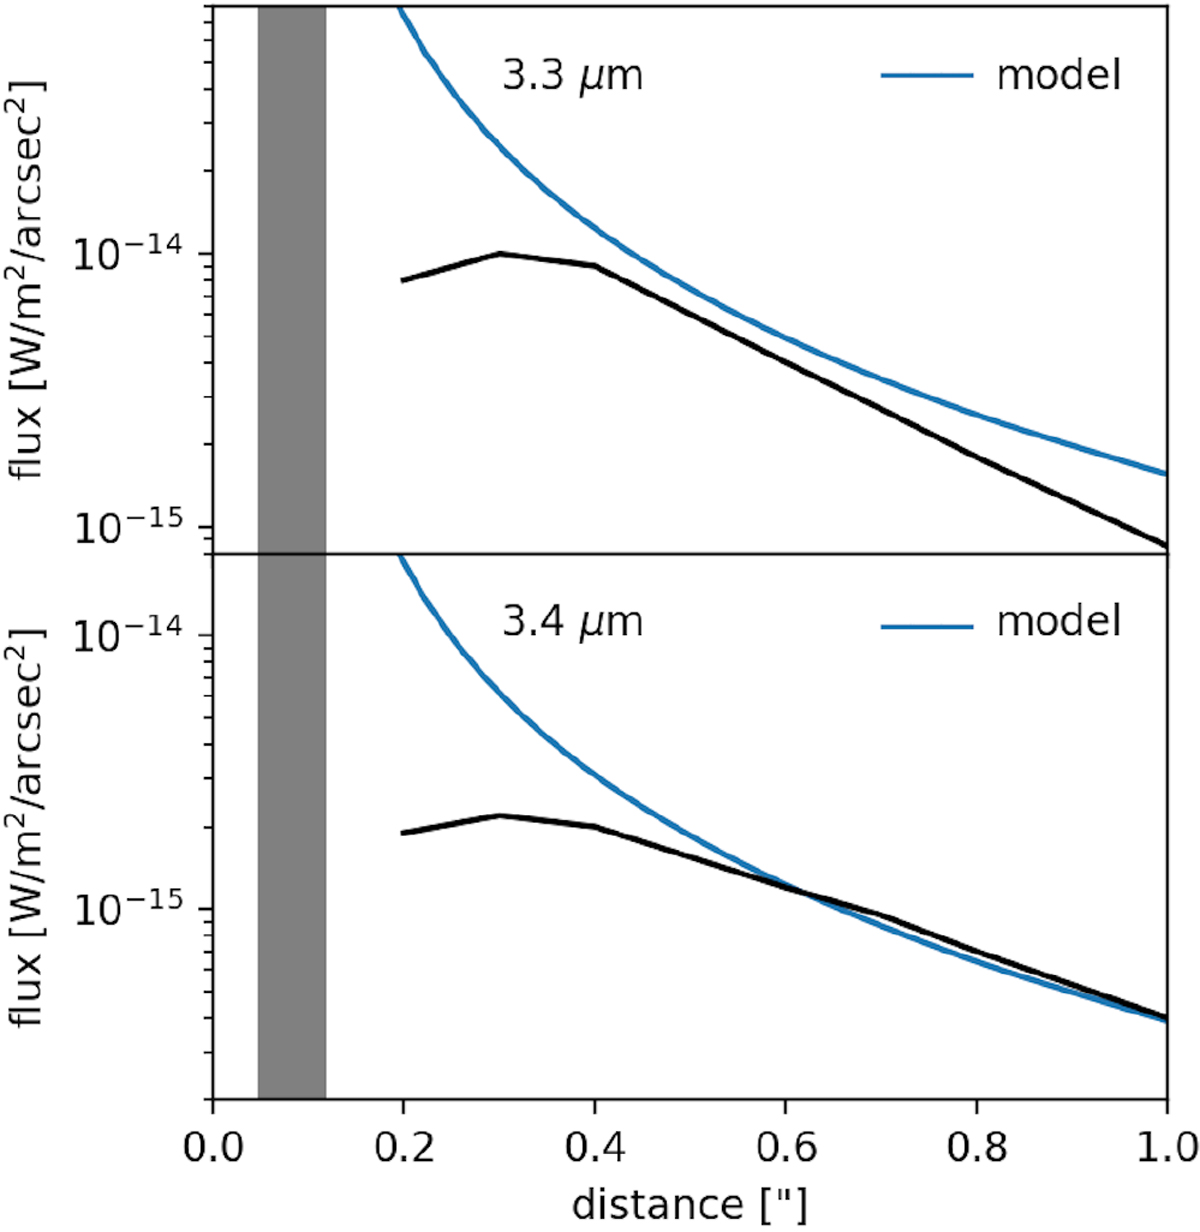
I3.3μm (top panel) and I3.4μm (bottom panel) as observed by NaCo (black) and as predicted by the model (blue). The fluxes are the sum of the integrals of the Gaussians related to each feature and averaged for different distances from the star in 0.1′′ steps. The transparent grey box on the left represents the distance up to which the cavity is extended in the POLARIS simulations: ~0.12′′ or 13 au). The models were convolved with a 0.1′′ Gaussian. Amask must be used around the central star because of the high magnitude gradient between on-star spectra and others.
Current usage metrics show cumulative count of Article Views (full-text article views including HTML views, PDF and ePub downloads, according to the available data) and Abstracts Views on Vision4Press platform.
Data correspond to usage on the plateform after 2015. The current usage metrics is available 48-96 hours after online publication and is updated daily on week days.
Initial download of the metrics may take a while.