Fig. 10
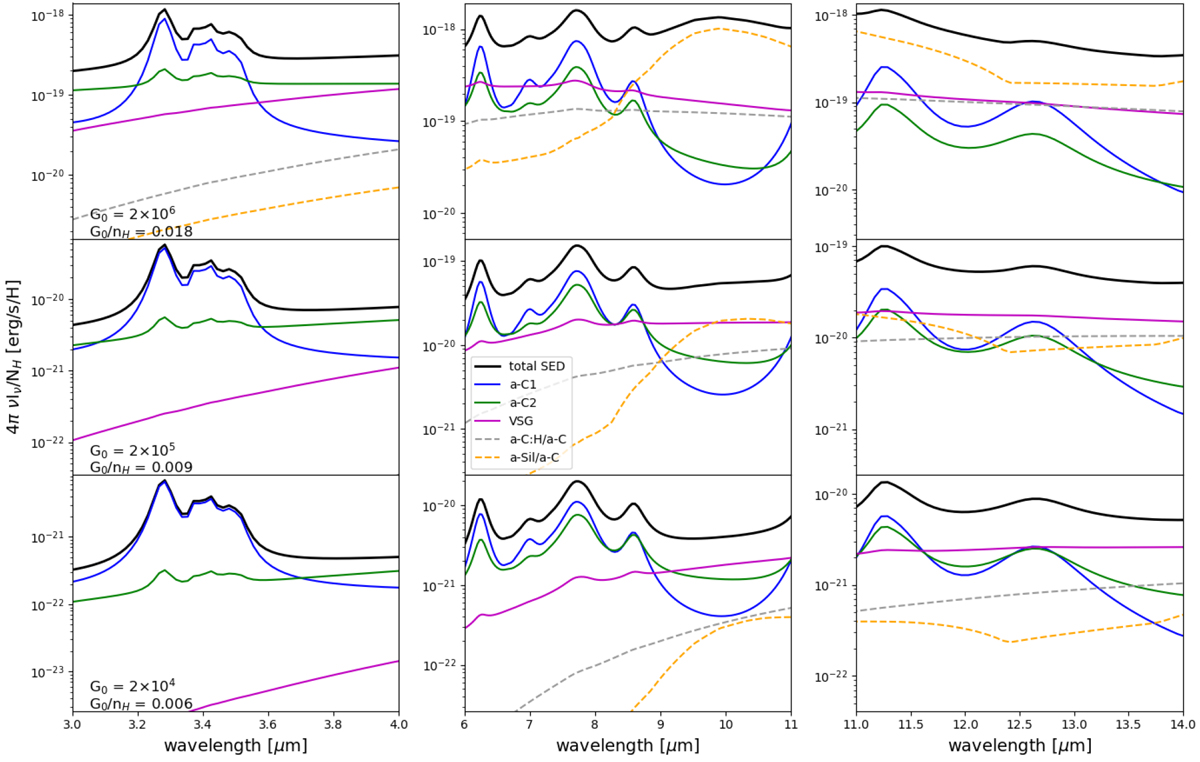
Grain population emission in the IR: tTotal emission (black), a-C1 (blue), a-C2 (green), VSG (magenta),a-C:H/a-C (grey dot), and a-Sil/a-C (orange dot). Left panels: NaCo range between 3 and 4 μm. Middle and right panels: range covered by VISIR filters: 8.6, 10.4, and 11.3 μm. From top to bottom: decrease in G0 values, which are 2 × 10⁶, 2 × 10⁵, and 2 × 10⁴. The corresponding distances to the star are 20, 75, and 200 au, respectively. The distance and G0 ∕nH are derived from Fig. 8.
Current usage metrics show cumulative count of Article Views (full-text article views including HTML views, PDF and ePub downloads, according to the available data) and Abstracts Views on Vision4Press platform.
Data correspond to usage on the plateform after 2015. The current usage metrics is available 48-96 hours after online publication and is updated daily on week days.
Initial download of the metrics may take a while.