Fig. 1
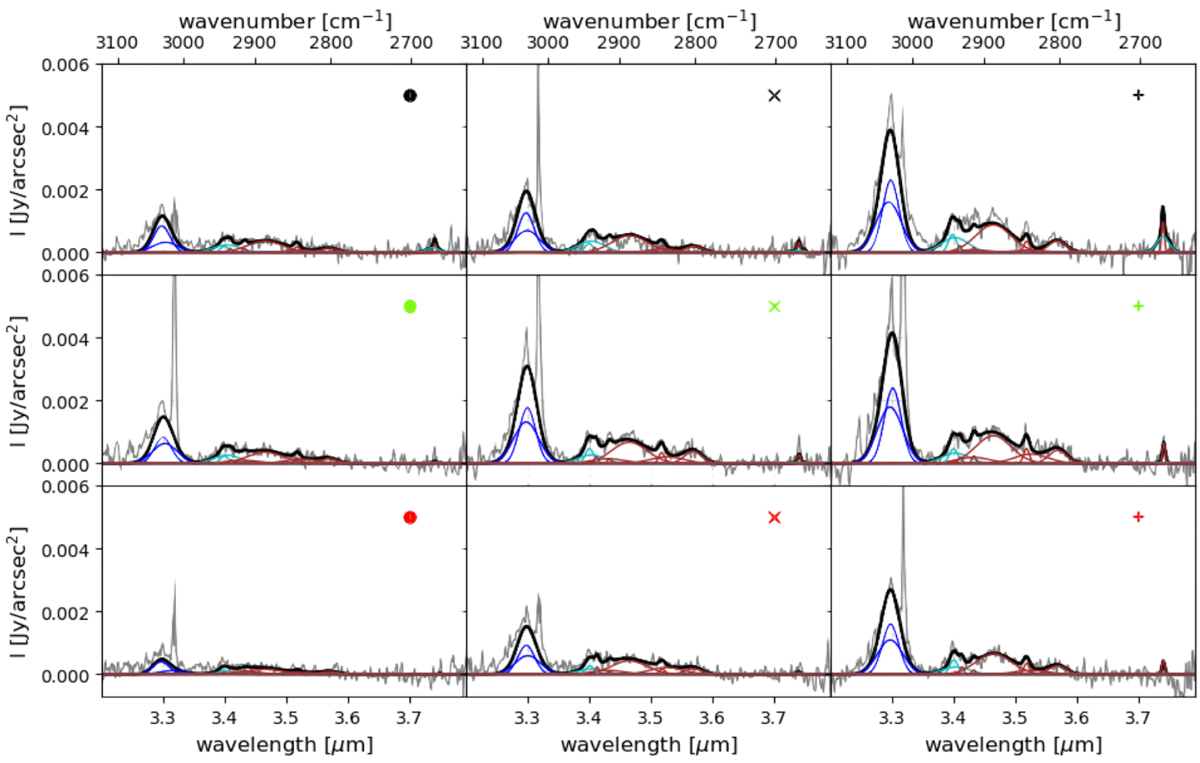
Mosaic of near-IR emission spectra of HD 100546 between 3.2 and 3.8 μm. Their location (coloured symbols) is reported in Fig. 2. The result of the decomposition with ROHSA (black) is overplotted on NaCo data (grey). Gaussians related to the 3.3 μm aromatic feature are shown in blue, and those related to the 3.4 μm aliphatic feature in cyan. Other features are plotted in brown.
Current usage metrics show cumulative count of Article Views (full-text article views including HTML views, PDF and ePub downloads, according to the available data) and Abstracts Views on Vision4Press platform.
Data correspond to usage on the plateform after 2015. The current usage metrics is available 48-96 hours after online publication and is updated daily on week days.
Initial download of the metrics may take a while.