Fig. 3.
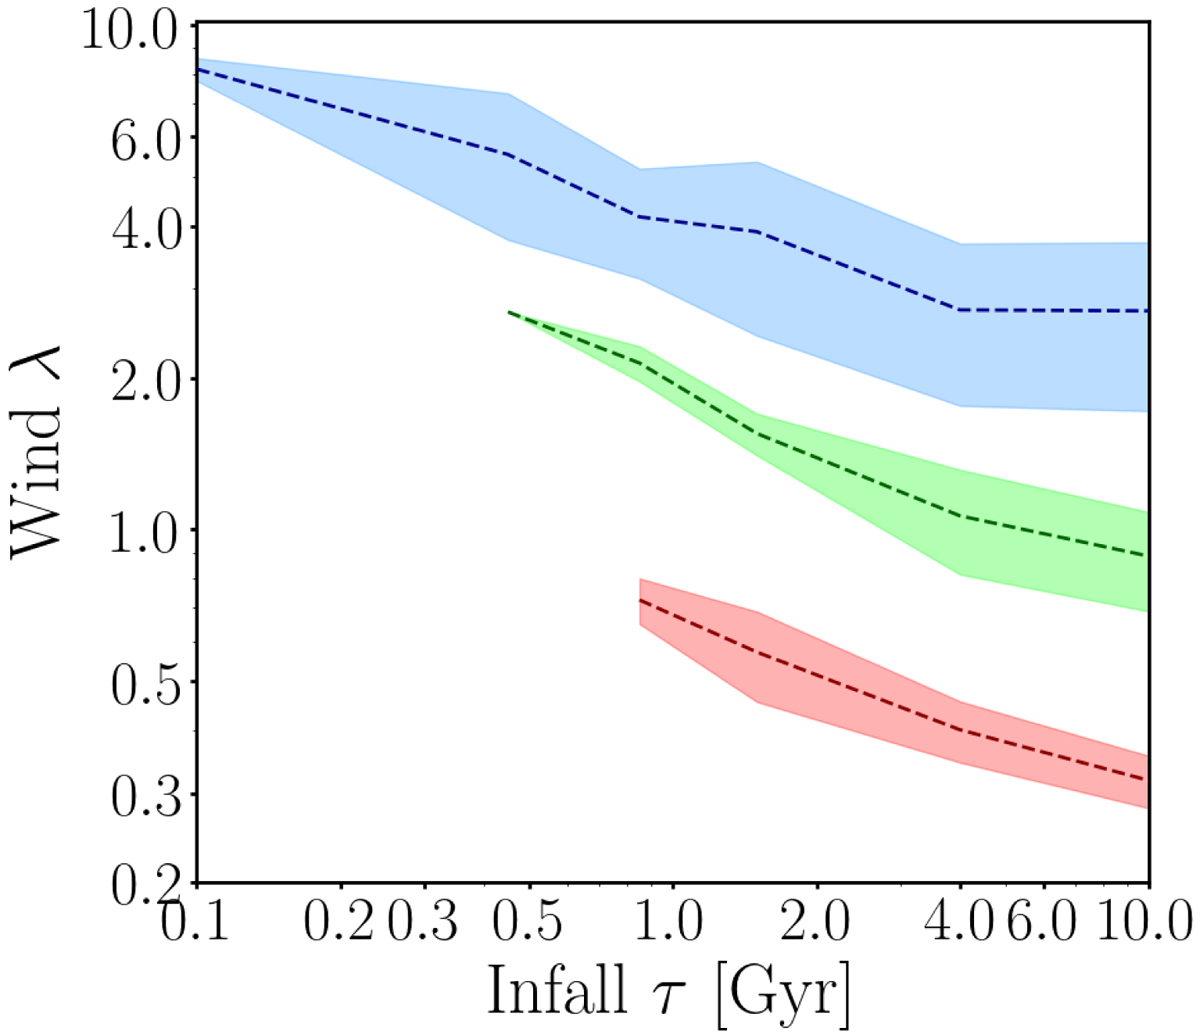
Wind parameter λ versus infall time scale τ of the star-forming galaxies which follow the local MZR and MSR (ES20) and in the following three different stellar mass bins: M⋆/M⊙ ≤ 109.5 (blue line and region), 109.5 < M⋆/M⊙ ≤ 1010.5 (green), and M⋆/M⊙ > 1010.5 (red). The dashed lines represent the average values, whereas the shaded coloured regions represent the 1σ dispersion.
Current usage metrics show cumulative count of Article Views (full-text article views including HTML views, PDF and ePub downloads, according to the available data) and Abstracts Views on Vision4Press platform.
Data correspond to usage on the plateform after 2015. The current usage metrics is available 48-96 hours after online publication and is updated daily on week days.
Initial download of the metrics may take a while.