Fig. 2.
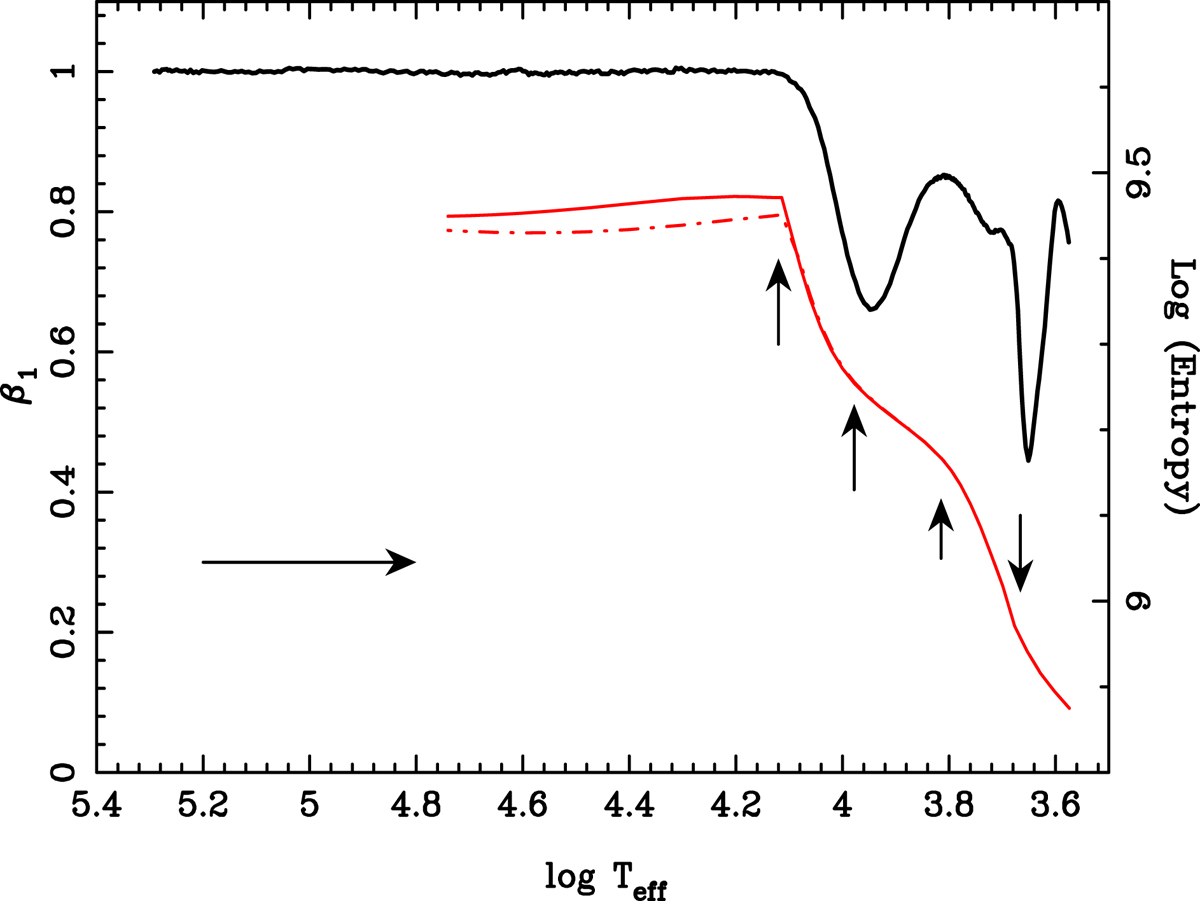
Entropy for the same models and conditions shown in Fig. 1 (red lines). The vertical arrows indicate the points where there is a marked variation of the entropy with effective temperature. The solid line represents the entropy for τ = 100 while the dashed-dotted line denotes τ = 500; both for log g = 8.5. The horizontal arrow indicates the direction of time evolution.
Current usage metrics show cumulative count of Article Views (full-text article views including HTML views, PDF and ePub downloads, according to the available data) and Abstracts Views on Vision4Press platform.
Data correspond to usage on the plateform after 2015. The current usage metrics is available 48-96 hours after online publication and is updated daily on week days.
Initial download of the metrics may take a while.