Free Access
Fig. 2
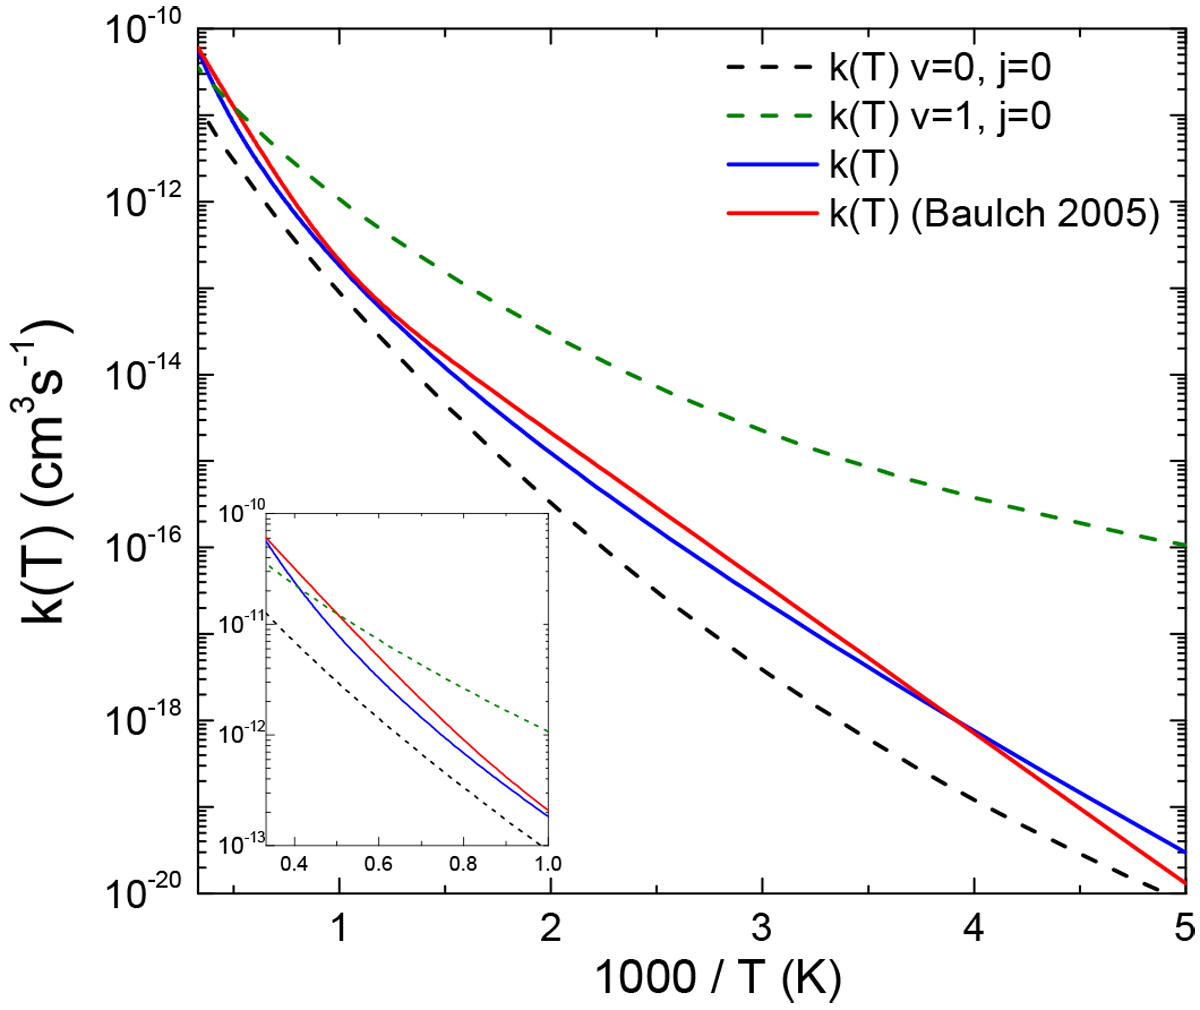
Thermal rate coefficient calculated in this work, given by Eq. (3), is compared with the experimental value (Baulch et al. 2005). Rate coefficients for H2 in the (v = 0, j = 0) and (v = 1, j = 0) states are also shown for the sake of comparison. The inset highlights the behavior at high temperatures (>1000 K).
Current usage metrics show cumulative count of Article Views (full-text article views including HTML views, PDF and ePub downloads, according to the available data) and Abstracts Views on Vision4Press platform.
Data correspond to usage on the plateform after 2015. The current usage metrics is available 48-96 hours after online publication and is updated daily on week days.
Initial download of the metrics may take a while.