Free Access
Fig. 4
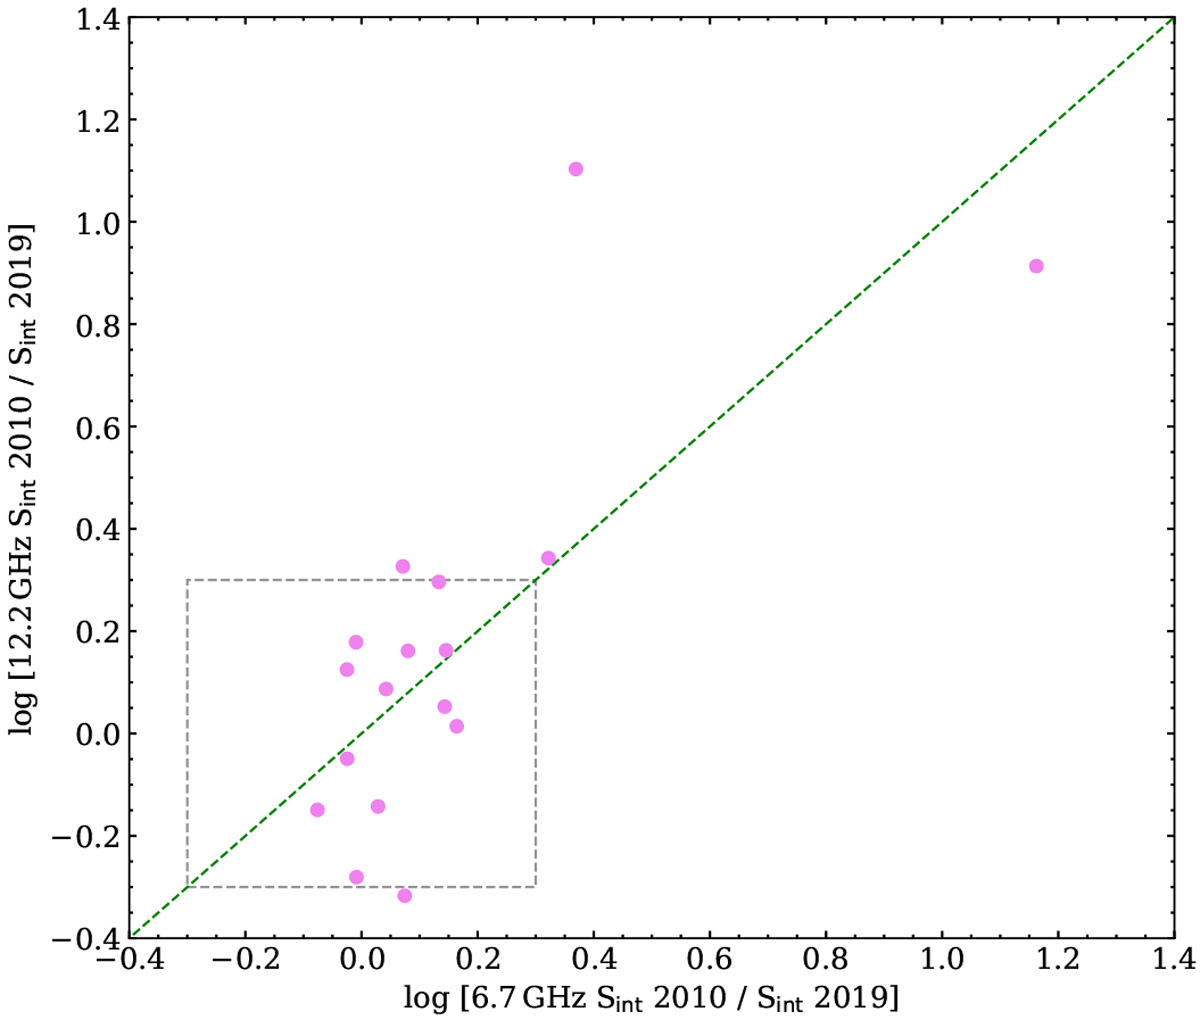
Relative change in the integrated flux density, Sint at 6.7 and 12.2 GHz between 2010 (Breen et al. 2015, 2016) and 2019 (this survey). The square marks 50% level of variability.
Current usage metrics show cumulative count of Article Views (full-text article views including HTML views, PDF and ePub downloads, according to the available data) and Abstracts Views on Vision4Press platform.
Data correspond to usage on the plateform after 2015. The current usage metrics is available 48-96 hours after online publication and is updated daily on week days.
Initial download of the metrics may take a while.