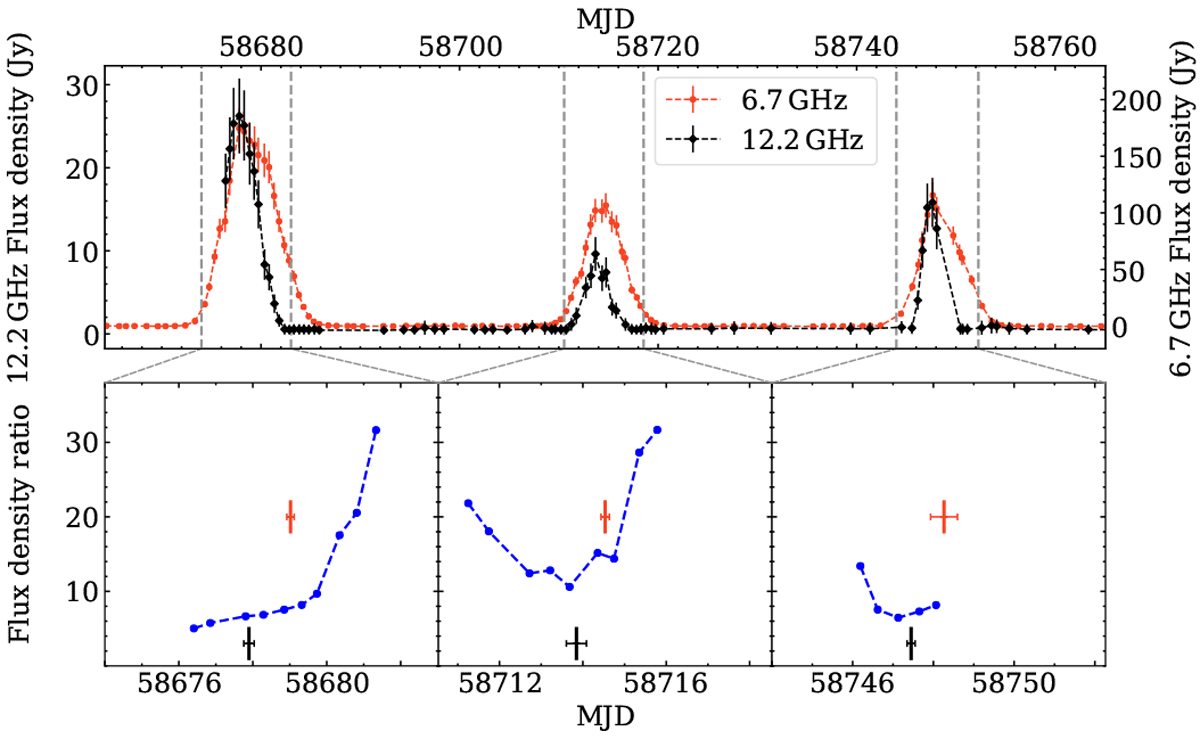
Fig. 2

Light curves of the −7.4 km s−1 methanol maser feature at 12.2 (black) and 6.7 GHz (red) for G107.298+5.639 (upper panel). Temporal changes in the 6.7–12.2 GHz flux density ratio are plotted (blue) (lower panel). The thick vertical error bars denote the flare maxima at 12.2 (black) and 6.7 GHz (red) calculated as the average value of the peak times obtained with the use of three methods (Table 2), whereas the thin horizontal error bars mark the corresponding standard errors.
Current usage metrics show cumulative count of Article Views (full-text article views including HTML views, PDF and ePub downloads, according to the available data) and Abstracts Views on Vision4Press platform.
Data correspond to usage on the plateform after 2015. The current usage metrics is available 48-96 hours after online publication and is updated daily on week days.
Initial download of the metrics may take a while.


