Fig. 1
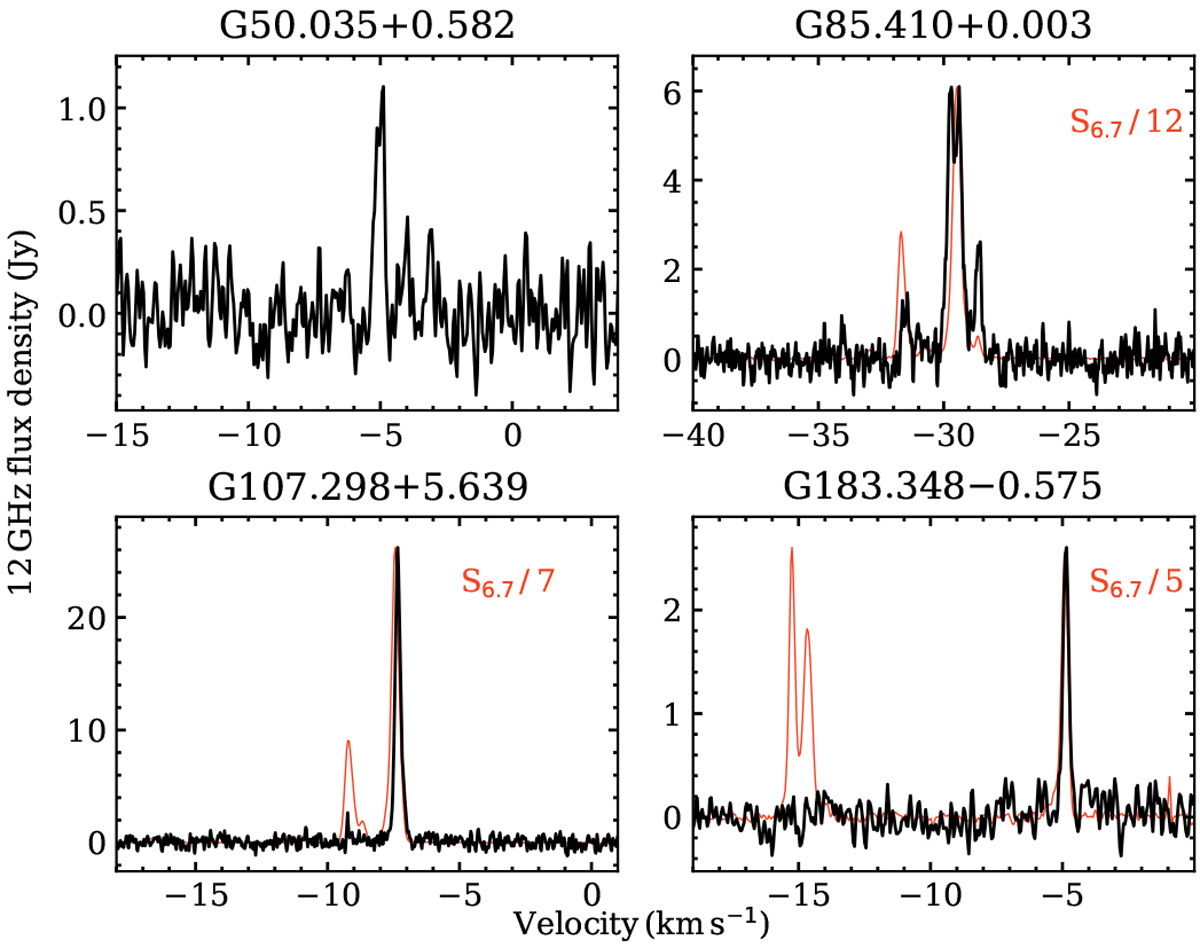
Spectra of the newly detected 12.2 GHz methanol maser sources. Spectra of 6.7 GHz methanol masers (red) are also shown when taken on the same day, with exception of G183.348−0.575, where the interval between observations was 41 d. For comparison purposes, the scale of 6.7 GHz flux density was reduced by the factor given in the upper right corner.
Current usage metrics show cumulative count of Article Views (full-text article views including HTML views, PDF and ePub downloads, according to the available data) and Abstracts Views on Vision4Press platform.
Data correspond to usage on the plateform after 2015. The current usage metrics is available 48-96 hours after online publication and is updated daily on week days.
Initial download of the metrics may take a while.