Fig. 7
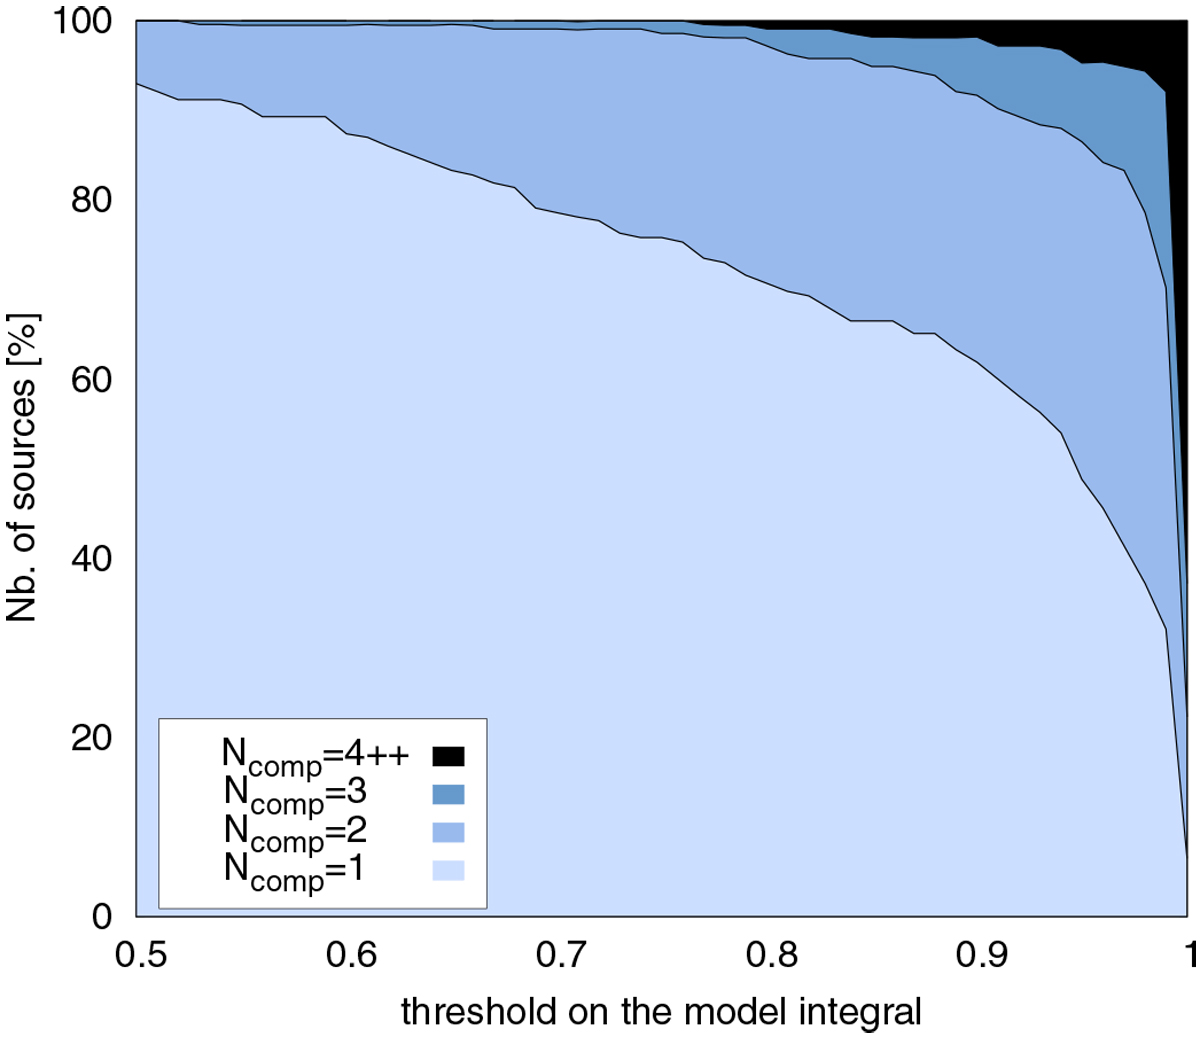
Percentage breakdown of the sources according to the number of components
Ncomp comprised inthe model ![]() (see Eq. (1)) selected automatically for thresholds on the model integral in the range of 0.5–1. For each source the model selected is the model with the smallest number of components that reaches the given threshold on the model integral. See text for further details on this selection.
(see Eq. (1)) selected automatically for thresholds on the model integral in the range of 0.5–1. For each source the model selected is the model with the smallest number of components that reaches the given threshold on the model integral. See text for further details on this selection.
Current usage metrics show cumulative count of Article Views (full-text article views including HTML views, PDF and ePub downloads, according to the available data) and Abstracts Views on Vision4Press platform.
Data correspond to usage on the plateform after 2015. The current usage metrics is available 48-96 hours after online publication and is updated daily on week days.
Initial download of the metrics may take a while.