Fig. 6
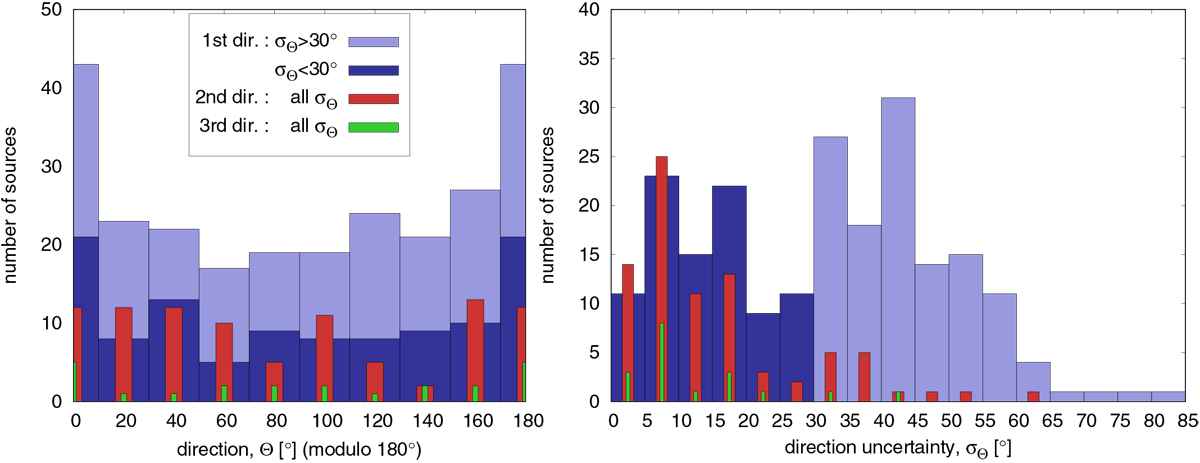
Distribution of the first, second, and third directions extracted from the astrometric variability of the 215 sources in our sample. The directions were derived by assuming a threshold of 0.9 on the model integral (see Fig. 7). The histogram in the left panel shows the primary directions in dark or light blue, the secondary directions in red, and the third directions in green. The histogram in the right panel shows the direction uncertainties with the same color-code. The primary directions are broken into two groups: reliable in dark blue and unreliable in light blue.
Current usage metrics show cumulative count of Article Views (full-text article views including HTML views, PDF and ePub downloads, according to the available data) and Abstracts Views on Vision4Press platform.
Data correspond to usage on the plateform after 2015. The current usage metrics is available 48-96 hours after online publication and is updated daily on week days.
Initial download of the metrics may take a while.