Fig. 5
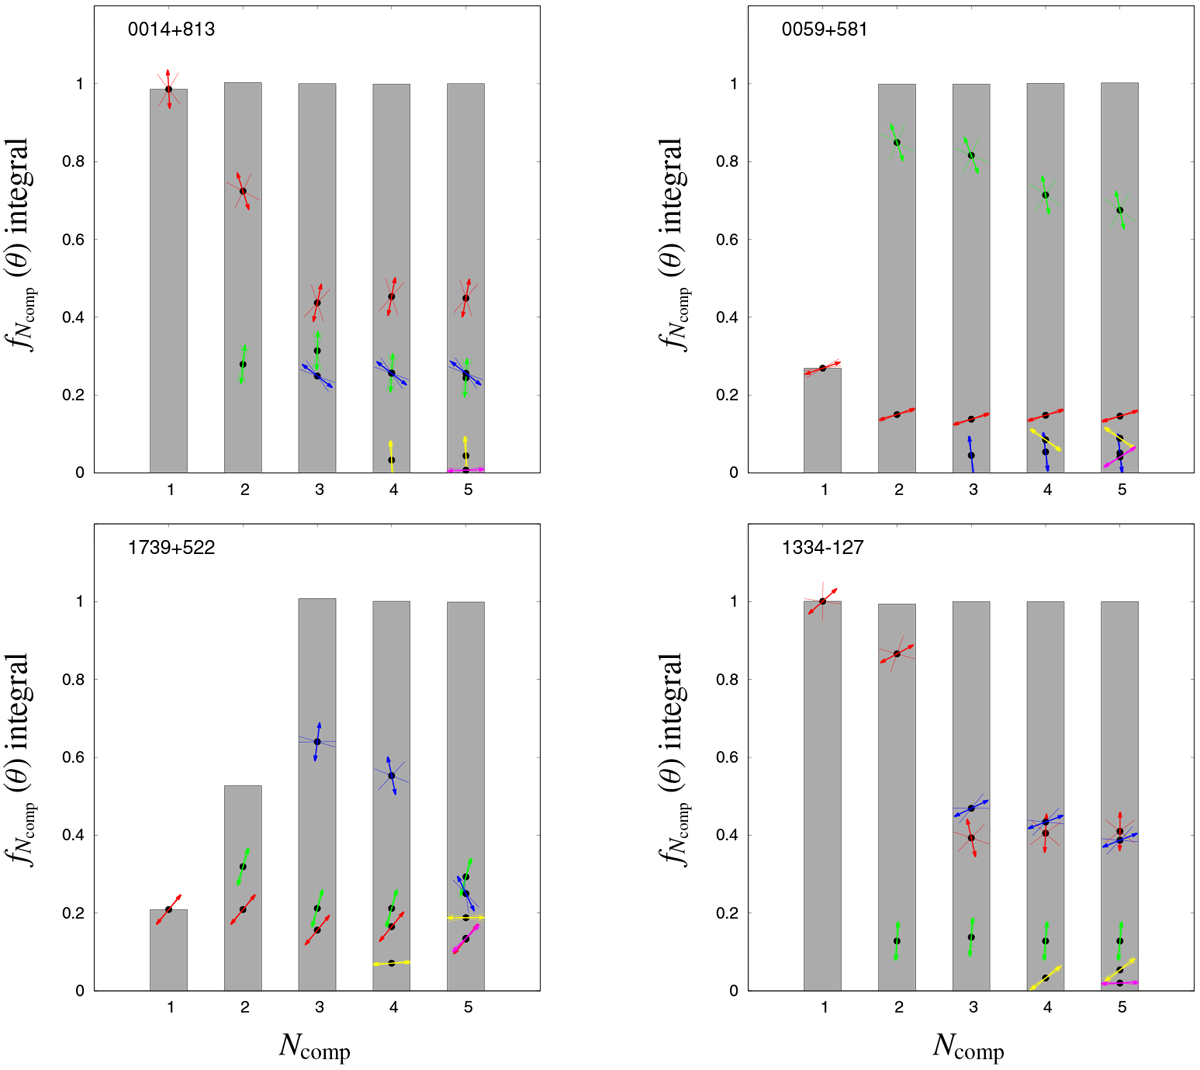
Bar charts showing the results of fitting 1–5 Gaussian components to the PDF of the sources 0014+813, 0059+581, 1739+522, and 1334−127 plotted in Fig. 4. The number of components adjusted is given beneath each gray bar. The height of each bar indicates the total integral value obtained for the corresponding fit. The arrows show the orientation of the resulting preferred directions and the associated uncertainty (represented as a cone around each arrow). The vertical position of the arrows reflects the contribution of the corresponding Gaussian component to the total integral. See Table 1 for the full parameter values.
Current usage metrics show cumulative count of Article Views (full-text article views including HTML views, PDF and ePub downloads, according to the available data) and Abstracts Views on Vision4Press platform.
Data correspond to usage on the plateform after 2015. The current usage metrics is available 48-96 hours after online publication and is updated daily on week days.
Initial download of the metrics may take a while.