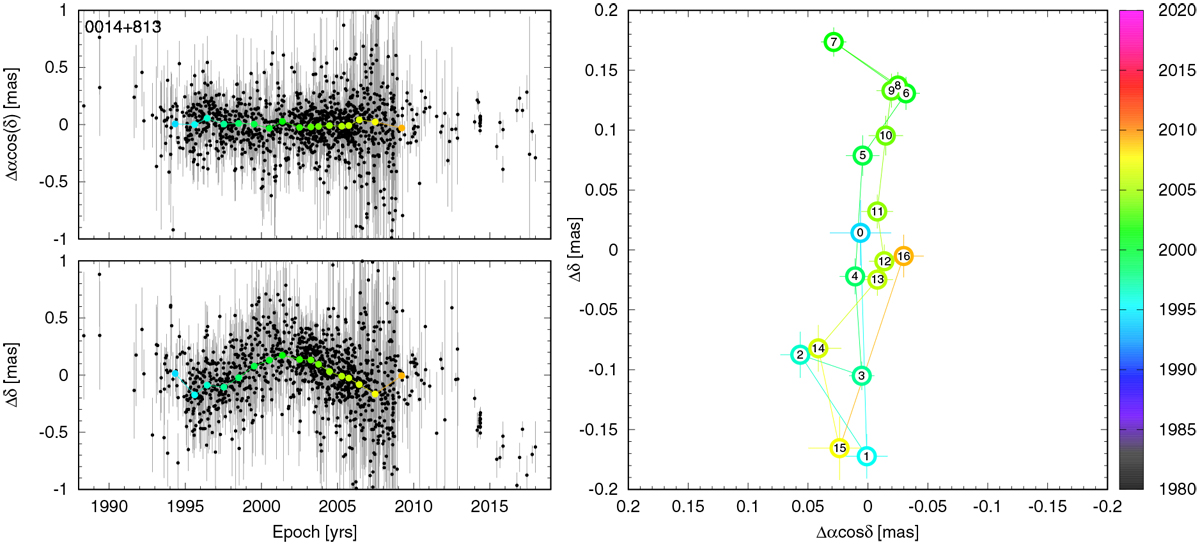
Fig. 3

Astrometric variability of the source 0014+813. Left: right ascension and declination time series (upper and lower plot, respectively) represented as offset to the weighted mean coordinates (black dots with error bars plotted in gray) and free from outliers. The colored dots show the associated reduced times series (see Sect. 2.3). The associated colored error bars are smaller than the size of the dots. Right: projection of the reduced coordinate time series on the plane of the sky. The color reflects the weighted mean observing epoch inherent to each reduced position. The numbers enclosed in the colored circles (starting from 0) indicate the successive reduced positions, which allows the apparent source trajectory to be followed on the sky.
Current usage metrics show cumulative count of Article Views (full-text article views including HTML views, PDF and ePub downloads, according to the available data) and Abstracts Views on Vision4Press platform.
Data correspond to usage on the plateform after 2015. The current usage metrics is available 48-96 hours after online publication and is updated daily on week days.
Initial download of the metrics may take a while.


