Fig. 2
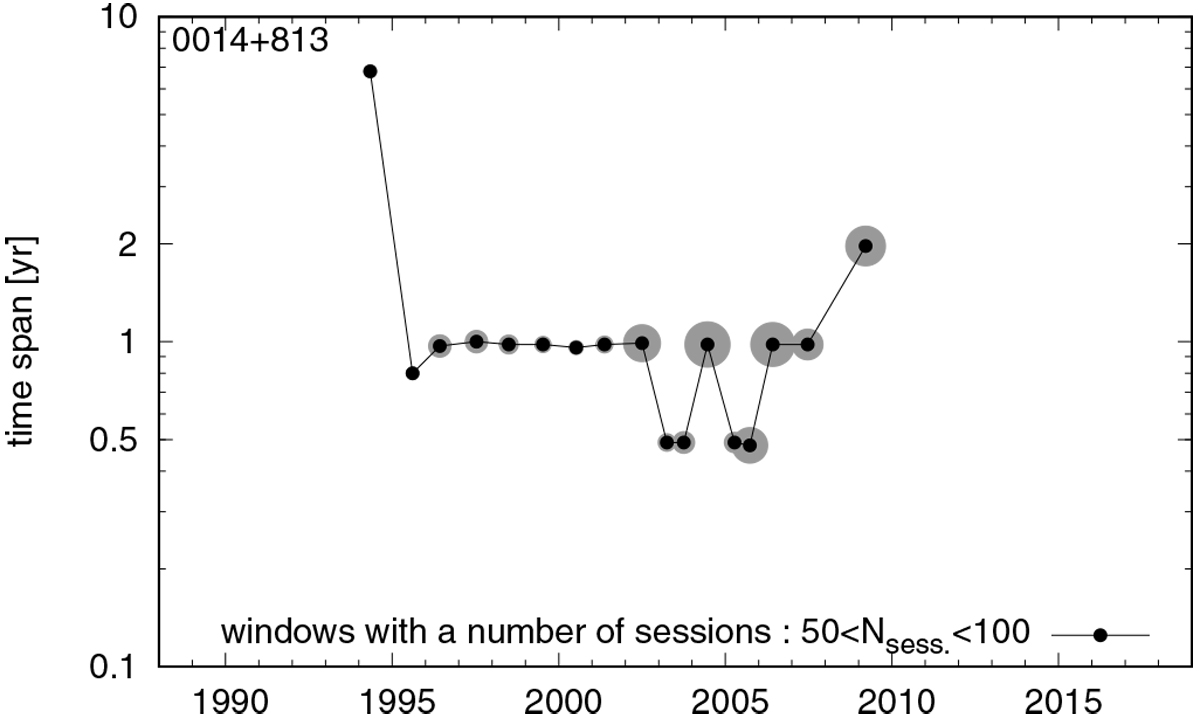
Time windows associated with the reduced positions of the source 0014+813. These windows correspondto the time spans over which session-based coordinates were averaged (see Sect. 2.3). The size of the gray circles is based on the number of sessions within the windows, close to 50 for the smallest circles and near 100 for the largest ones. The abscissa indicates the weighted mean
![]() of the individual epochs within each window.
of the individual epochs within each window.
Current usage metrics show cumulative count of Article Views (full-text article views including HTML views, PDF and ePub downloads, according to the available data) and Abstracts Views on Vision4Press platform.
Data correspond to usage on the plateform after 2015. The current usage metrics is available 48-96 hours after online publication and is updated daily on week days.
Initial download of the metrics may take a while.