Fig. 1
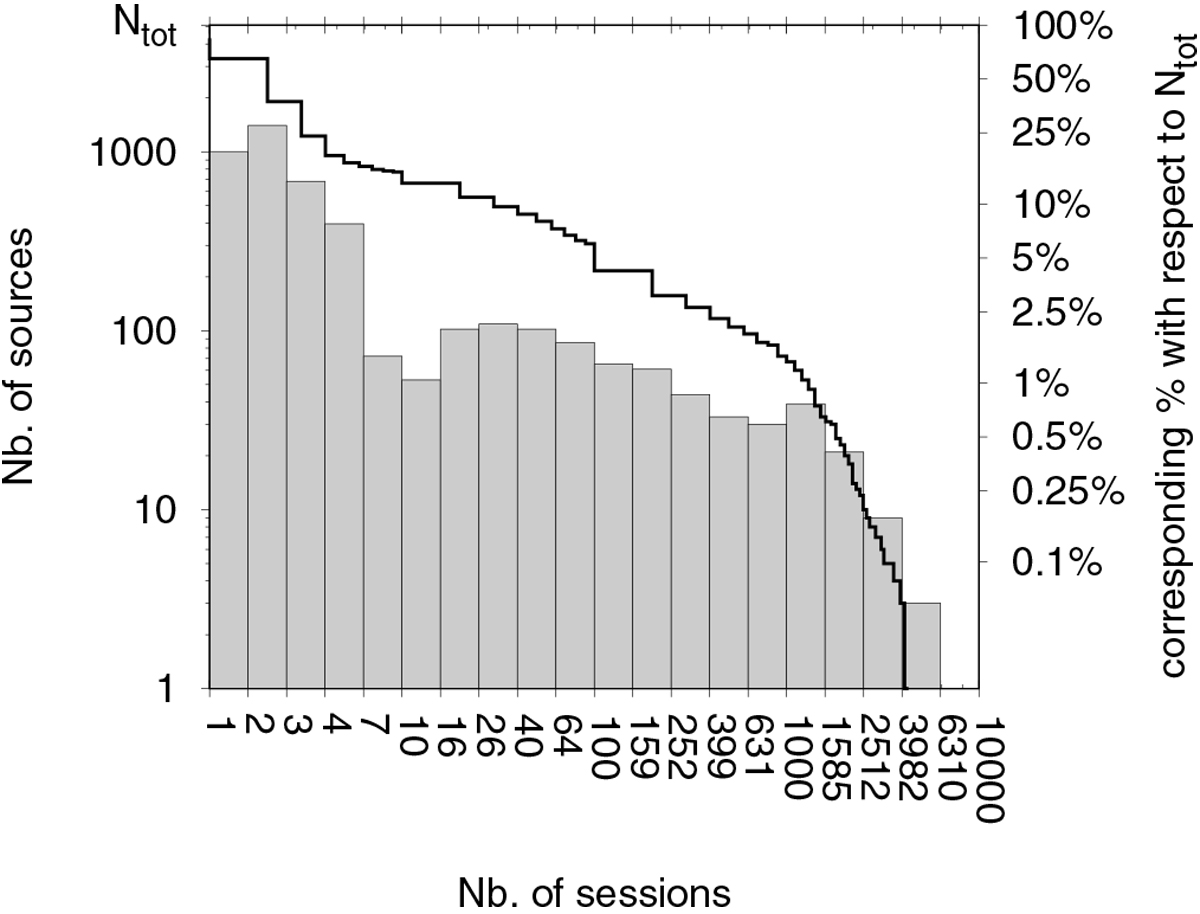
Distribution (in logarithmic scale) of the 5099 sources considered in this analysis according to the number of sessions in which they were observed. Outliers and sessions that had too few observations were discarded (see text). The lower and upper numbers encompassing each bin in abscissa indicate the range of sessions in which the sources comprised in this bin were observed. For example, the sources in the bin
![]() were each observed between 40 and 63 times. In this representation the first three bins correspond to the number of sources observed only once, twice, and three times, respectively. The black thick line displays the reversed cumulative distribution.
were each observed between 40 and 63 times. In this representation the first three bins correspond to the number of sources observed only once, twice, and three times, respectively. The black thick line displays the reversed cumulative distribution.
Current usage metrics show cumulative count of Article Views (full-text article views including HTML views, PDF and ePub downloads, according to the available data) and Abstracts Views on Vision4Press platform.
Data correspond to usage on the plateform after 2015. The current usage metrics is available 48-96 hours after online publication and is updated daily on week days.
Initial download of the metrics may take a while.