Fig. 8.
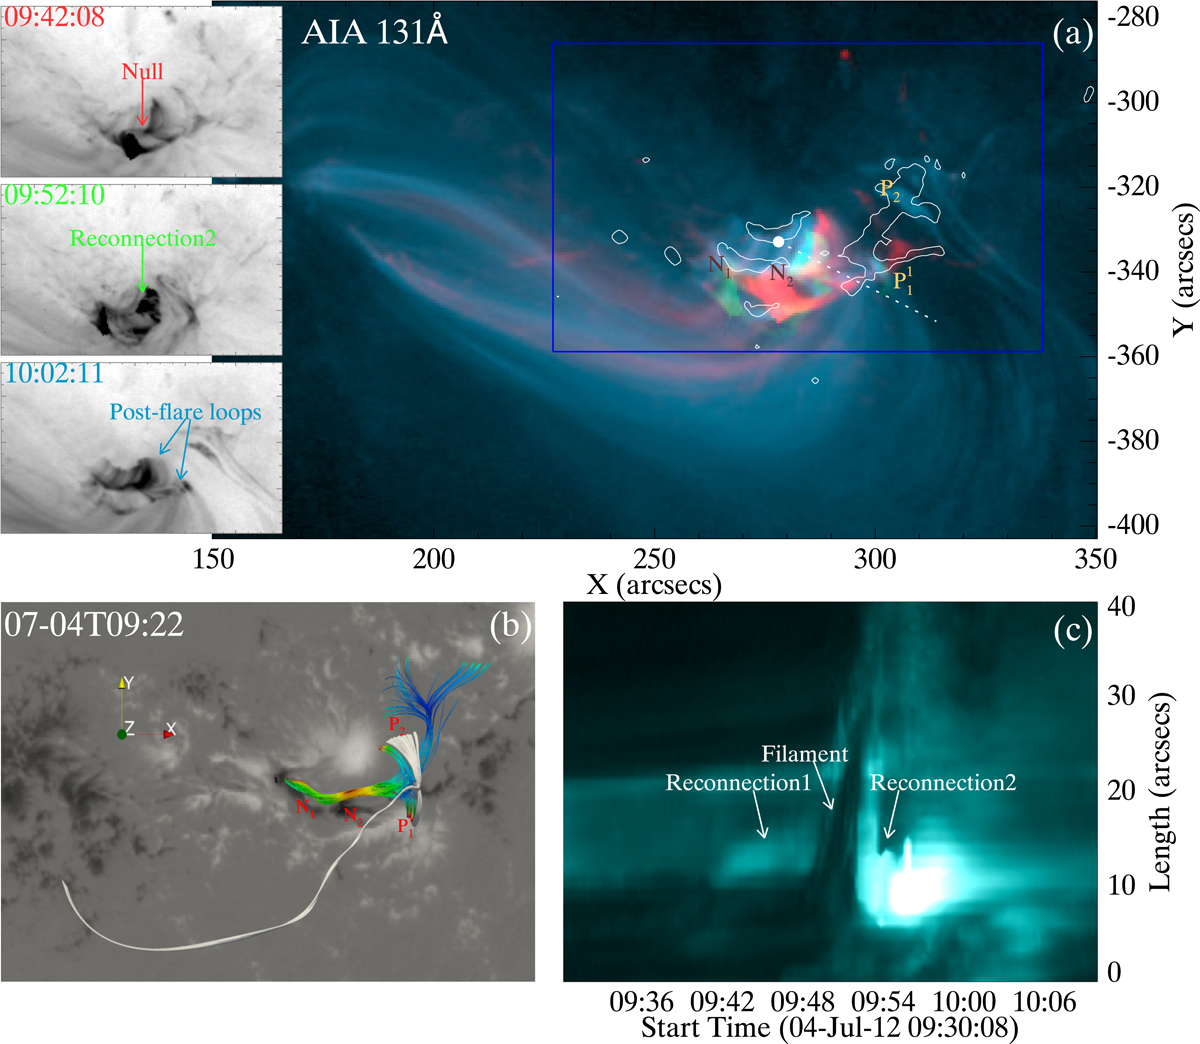
Comparison between the eruptive characteristics and the magnetic topology. (a) Composite image of AIA 131 Å observations at three different times. The observation at 09:42 is shown in red, the one at 09:52 is shown in green, and the one at 10:02 is shown in blue, which display the coronal null, the main phase of reconnection, and the post-flare loops, respective. The three insets at the left are the negative images at the three times. The white contours outline the flare ribbons in the 1600 Å observation. The blue rectangle has the same FOV as the one in Fig. 1b. White-dashed line indicates the position of the slice used in panel c. White dot marks the start of the slice. (b) Flux rope (shown in iridescence) and the magnetic field lines of the configurations associated with the null (shown in gray) in the extrapolated NLFFF. Panel b has roughly the same FOV as panel a. (c) Time-distance plot of the slice, showing the two phases of reconnection and the rise of the filament.
Current usage metrics show cumulative count of Article Views (full-text article views including HTML views, PDF and ePub downloads, according to the available data) and Abstracts Views on Vision4Press platform.
Data correspond to usage on the plateform after 2015. The current usage metrics is available 48-96 hours after online publication and is updated daily on week days.
Initial download of the metrics may take a while.