Fig. 7.
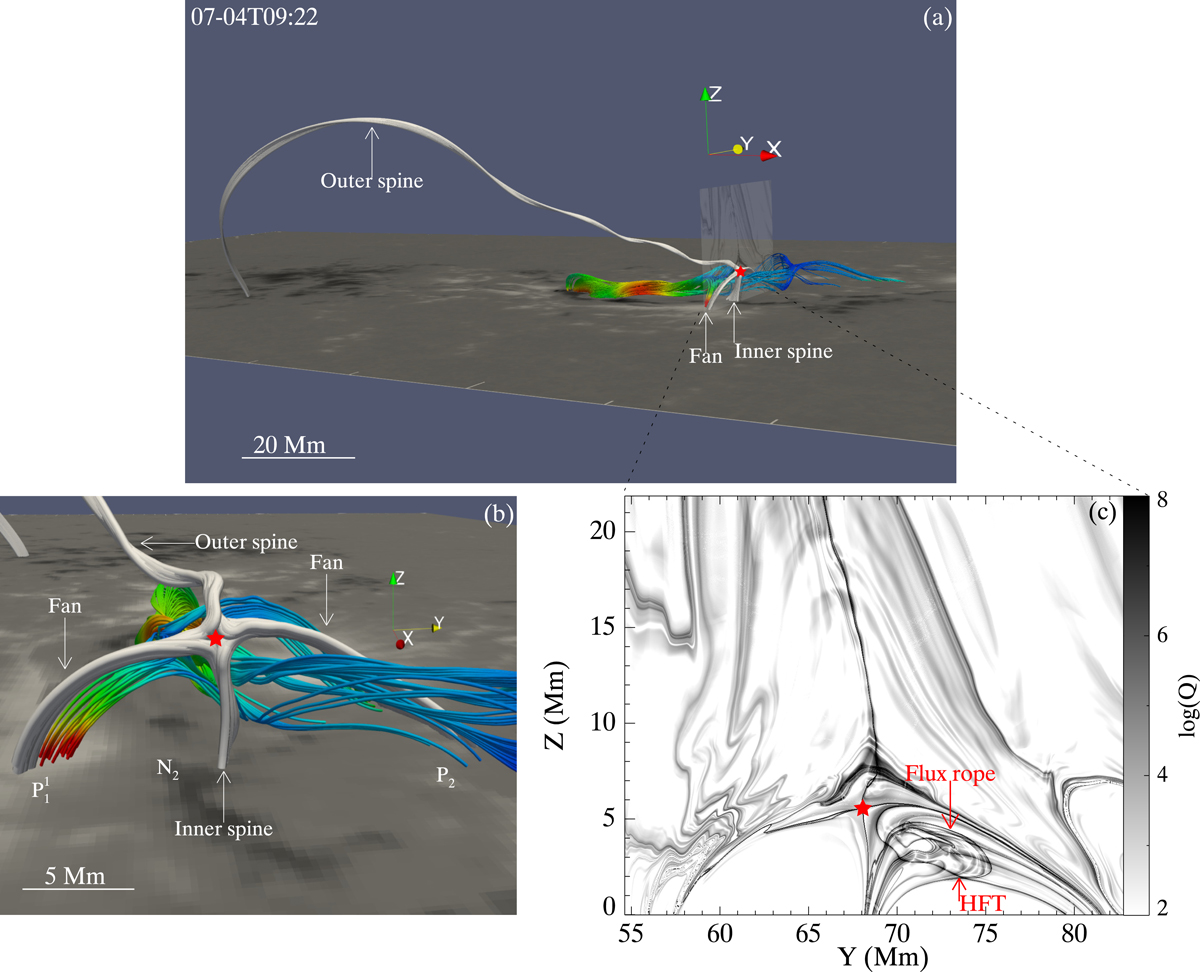
Null point above the flux rope, which is marked as a red star. (a)–(b) Different view of the null point. Magnetic field lines traced from different topological structures are shown in different colors. The iridescent lines belong to the flux rope, while the gray lines are for the coronal configurations associated with the null point. (c) The distribution of logarithmic Q in a vertical plane crossing the magnetic null. The position of the plane is indicated by a semi-transparent cut in panel a. The photospheric Bz in panels a and b saturates at ±2000 G.
Current usage metrics show cumulative count of Article Views (full-text article views including HTML views, PDF and ePub downloads, according to the available data) and Abstracts Views on Vision4Press platform.
Data correspond to usage on the plateform after 2015. The current usage metrics is available 48-96 hours after online publication and is updated daily on week days.
Initial download of the metrics may take a while.