Fig. 6.
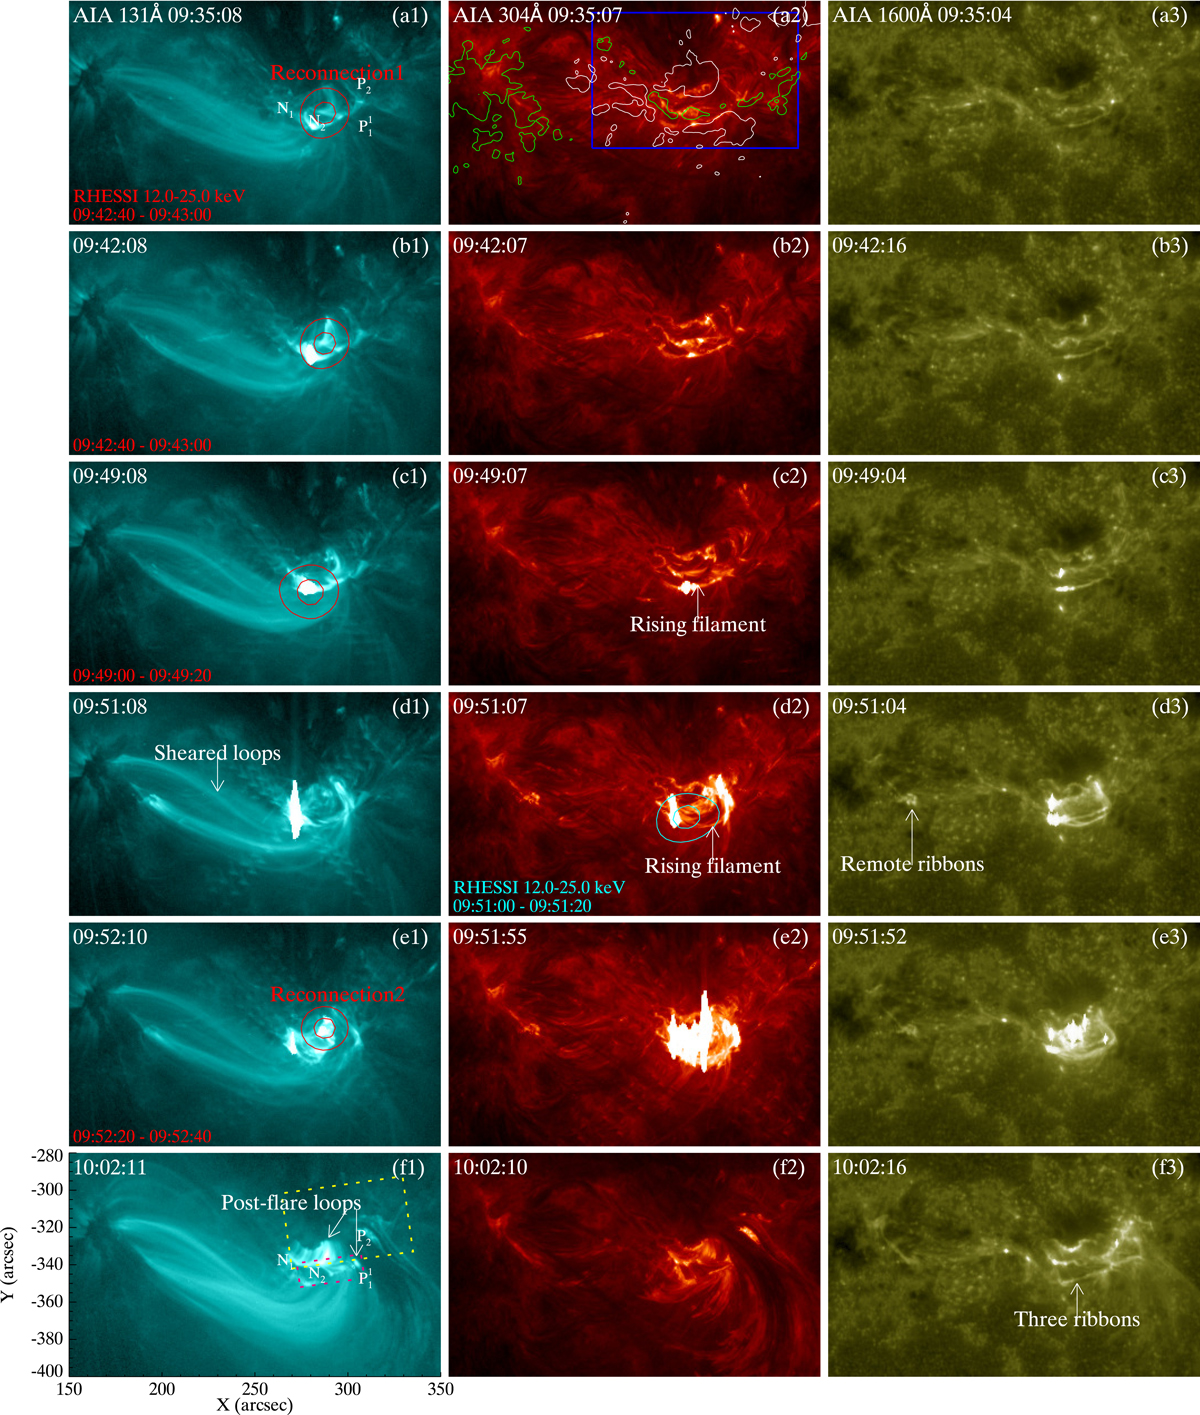
Eruptive characteristics of the flare. (a1)–(f1) Eruptive details observed by the AIA 131 Å passband. The white arrows in (f1) point out two sets of post-flare loops. The two dashed boxes in (f1) are the same as the ones in Fig. 4g, enclosing the northern and southern sets of loops. The polarities ![]() , N1,P2, and N2 are marked in panels a1 and f1 for reference. (a2)–(f2) Eruption details captured by AIA 304 Å passband, showing the eruption of the filament. The photospheric Bz is overplotted in panel a2 for comparison, with white (green) contours for the positive (negative) polarities. The contour levels are −600 G and 600 G. (a3)–(f3) Flare ribbons observed in the 1600 Å passband. The RHESSI HXR sources in the 12–25 keV energy bands are overplotted in panels a1, b1, c1, d2, and e1, with contour levels at 60% and 90% of the peak flux. The blue rectangle in panel a2 has the same FOV as the one in Fig. 1b. An associated animation lasting form 09:00 to 10:10 on 2012 July 4 is available online, incorporating the details of the precursor and the main flare, and a C9.7-class flare lasting from 09:00 to 09:09. Brightenings at the BP region and flare ribbons during the C9.7-class flare are indicated by arrows in the movie. The BP region is also enclosed by a green rectangle, which is the same as the one in Fig. 1b. See relevant discussion in Sect. 4.
, N1,P2, and N2 are marked in panels a1 and f1 for reference. (a2)–(f2) Eruption details captured by AIA 304 Å passband, showing the eruption of the filament. The photospheric Bz is overplotted in panel a2 for comparison, with white (green) contours for the positive (negative) polarities. The contour levels are −600 G and 600 G. (a3)–(f3) Flare ribbons observed in the 1600 Å passband. The RHESSI HXR sources in the 12–25 keV energy bands are overplotted in panels a1, b1, c1, d2, and e1, with contour levels at 60% and 90% of the peak flux. The blue rectangle in panel a2 has the same FOV as the one in Fig. 1b. An associated animation lasting form 09:00 to 10:10 on 2012 July 4 is available online, incorporating the details of the precursor and the main flare, and a C9.7-class flare lasting from 09:00 to 09:09. Brightenings at the BP region and flare ribbons during the C9.7-class flare are indicated by arrows in the movie. The BP region is also enclosed by a green rectangle, which is the same as the one in Fig. 1b. See relevant discussion in Sect. 4.
Current usage metrics show cumulative count of Article Views (full-text article views including HTML views, PDF and ePub downloads, according to the available data) and Abstracts Views on Vision4Press platform.
Data correspond to usage on the plateform after 2015. The current usage metrics is available 48-96 hours after online publication and is updated daily on week days.
Initial download of the metrics may take a while.