Fig. 5.
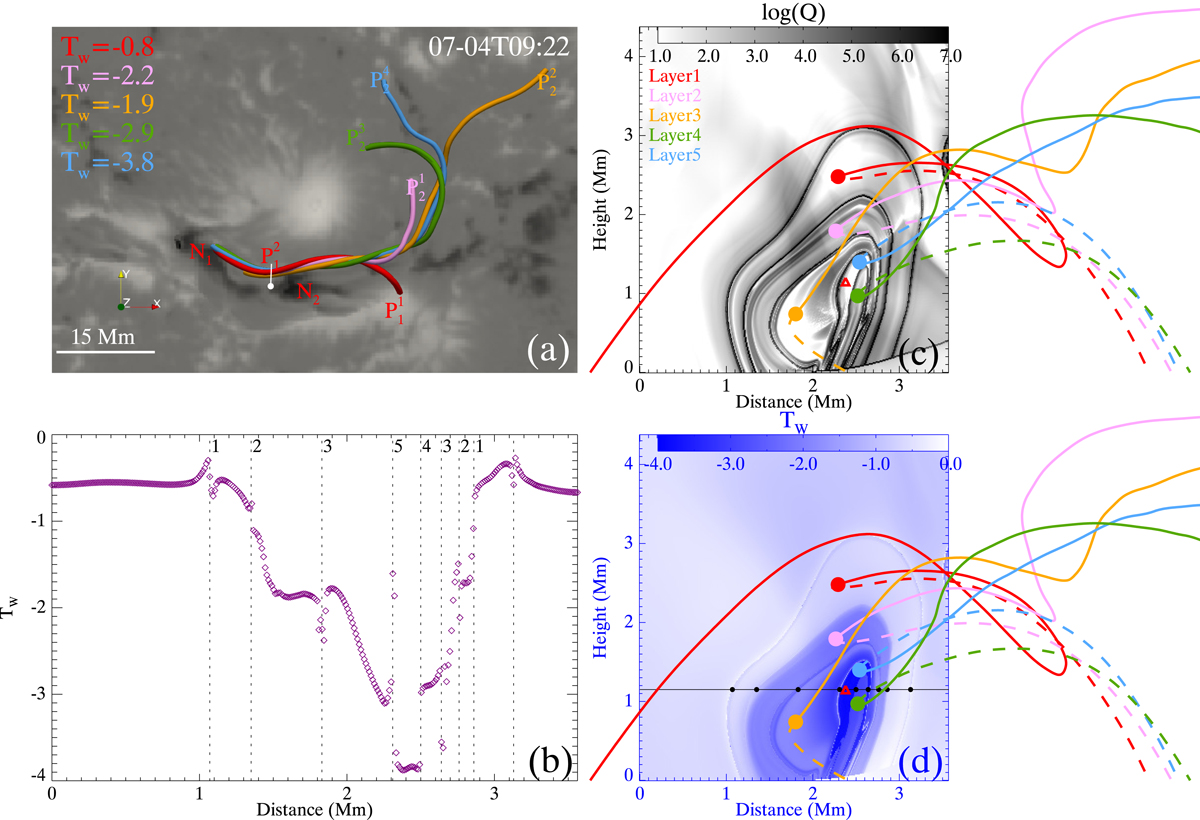
Different layers of the flux rope. (a) Representative field line from each layer. The panels have the same FOV as Fig. 2. The photospheric Bz saturates at ±2000 G, with white (black) patches indicating the positive (negative) polarities. (b) Profile of Tw along the black line in d, which is parallel to the photopshere and passing the extremum point. The vertical-dashed lines correspond to the black dots in panel d. The digits mark the layers of the flux rope. (c)–(d) Distributions of the logarithmic Q and Tw in the same plane indicated in Fig. 4b. The position of the plane is also indicated by a white line in panel a, with the white dot denoting the start point of the plane. The representative field lines from each layer are overplotted. The solid parts of the lines are in front of the plane (seen along the line of sight), while the dashed parts are behind the plane. The colored dots mark the positions where the field lines thread the plane. The black dots indicate locations where the horizontal black line intersects with the high Q boundaries.
Current usage metrics show cumulative count of Article Views (full-text article views including HTML views, PDF and ePub downloads, according to the available data) and Abstracts Views on Vision4Press platform.
Data correspond to usage on the plateform after 2015. The current usage metrics is available 48-96 hours after online publication and is updated daily on week days.
Initial download of the metrics may take a while.