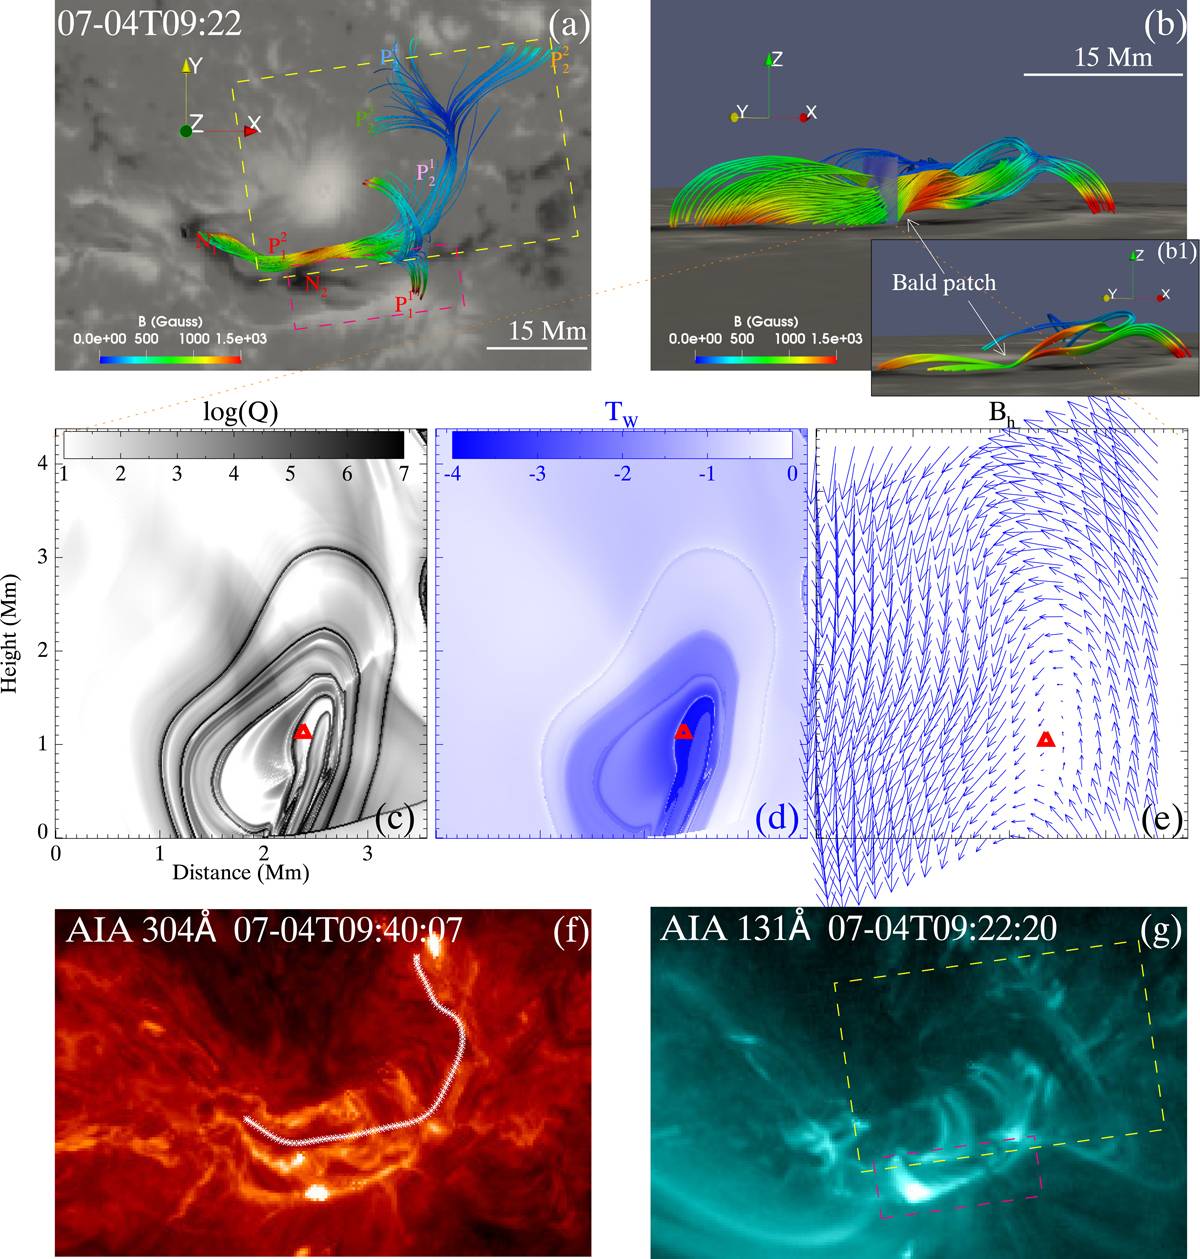
Fig. 4.
Configuration of the flux rope that is identified in the extrapolated NLFFFs. (a)–(b) The flux rope seen from two different views. The iridescence colors vary with the strength of the field. Panel a has the same FOV as Fig. 2. The inset (b1) shows the field lines passing through the BP specifically. The yellow-dashed rectangle marks the northern branches of the flux rope, while the pink one is for the southern branch. The photospheric Bz saturates at ±2000 G in these panels, with white (black) patches indicating the positive (negative) polarities. (c)–(e) Distribution of logarithmic Q, Tw, and in-plane field vector in a vertical plane, which is perpendicular to the local apex of the possible axis proxy. The red triangles indicate the local extremum of Tw, i.e., the location where the possible axis proxy threads the plane. The position of the plane is indicated by the semi-transparent cut in panel b. (f) Image of the AIA 304 Å passband, showing the filament. The white line denotes the estimated axis of the flux rope from NLFFFs. (g) The image of the AIA 131 Å passband, showing two sets of loops overlying the northern and southern branches of the flux rope. The colored dashed rectangles enclose the same regions as the ones in panel a. Panels a, f, and g have the same FOV.
Current usage metrics show cumulative count of Article Views (full-text article views including HTML views, PDF and ePub downloads, according to the available data) and Abstracts Views on Vision4Press platform.
Data correspond to usage on the plateform after 2015. The current usage metrics is available 48-96 hours after online publication and is updated daily on week days.
Initial download of the metrics may take a while.