Fig. 3.
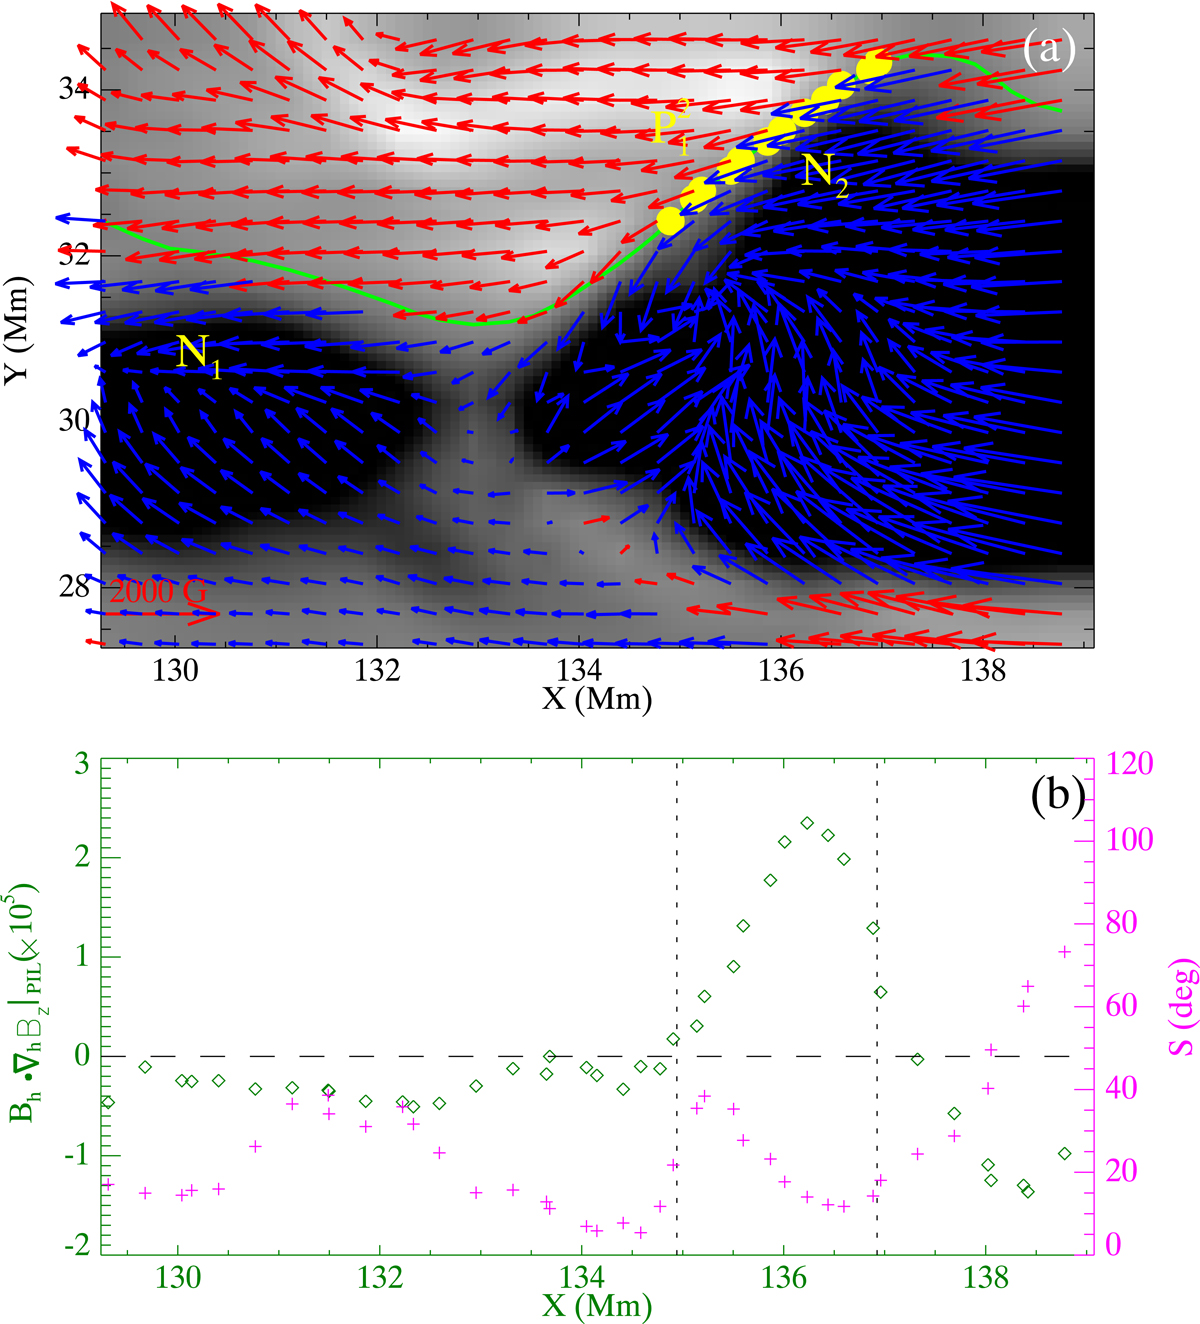
Bald patch between N2 and ![]() . (a) Photospheric vector magnetogram of the BP region. The FOV of this panel is indicated by the green box in Fig. 2h1. The Bz component of the field is plotted as the background, saturating at ±600 G. The red (blue) arrows denote the horizontal component (Bh) of the field that correspond to the positive (negative) polarities. The green line indicates the PIL between
. (a) Photospheric vector magnetogram of the BP region. The FOV of this panel is indicated by the green box in Fig. 2h1. The Bz component of the field is plotted as the background, saturating at ±600 G. The red (blue) arrows denote the horizontal component (Bh) of the field that correspond to the positive (negative) polarities. The green line indicates the PIL between ![]() and the group of N1 and N2, which is obtained at the contour line of Bz = 0. The yellow parts of the PIL mark the BP section. (b) Values of (Bh · ∇hBz)|PIL (shown in green) and the shear angle S (shown in magenta) of all pixels along the PIL. The two vertical-dashed lines in (b) enclose the BP region.
and the group of N1 and N2, which is obtained at the contour line of Bz = 0. The yellow parts of the PIL mark the BP section. (b) Values of (Bh · ∇hBz)|PIL (shown in green) and the shear angle S (shown in magenta) of all pixels along the PIL. The two vertical-dashed lines in (b) enclose the BP region.
Current usage metrics show cumulative count of Article Views (full-text article views including HTML views, PDF and ePub downloads, according to the available data) and Abstracts Views on Vision4Press platform.
Data correspond to usage on the plateform after 2015. The current usage metrics is available 48-96 hours after online publication and is updated daily on week days.
Initial download of the metrics may take a while.