Fig. 2.
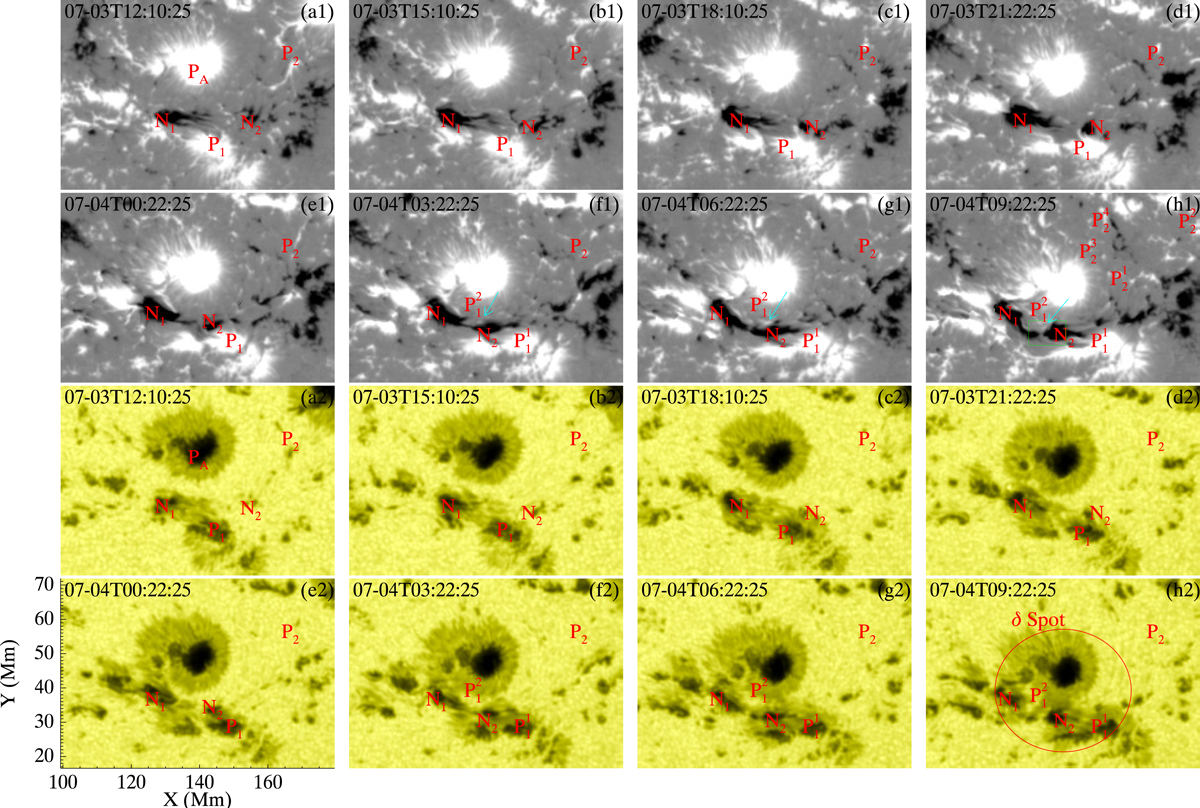
Formation of δ sunspot. Panels a1–h1 display the photospheric Bz magnetograms, with Bz saturating at ±1200 G, while panels a2–h2 are the continuum images. Label PA denotes a pre-existent positive polarity. N1 and P1 indicate the negative and positive polarities of bipole1, respectively, while N2 and P2 are for bipole2. ![]() and
and ![]() denote two patches of P1. The newly formed
denote two patches of P1. The newly formed ![]() , which is located at the north of N2, is further indicated by a cyan arrow in panels f1–h1. The labels
, which is located at the north of N2, is further indicated by a cyan arrow in panels f1–h1. The labels ![]() ,
, ![]() ,
, ![]() , and
, and ![]() in panel h1 are discrete patches of P2, corresponding to different field lines in Fig. 5. The green rectangle in panel h1 indicates the FOV of Fig. 3. The red circle in (h2) marks the δ sunspot configuration. An associated animation is available online.
in panel h1 are discrete patches of P2, corresponding to different field lines in Fig. 5. The green rectangle in panel h1 indicates the FOV of Fig. 3. The red circle in (h2) marks the δ sunspot configuration. An associated animation is available online.
Current usage metrics show cumulative count of Article Views (full-text article views including HTML views, PDF and ePub downloads, according to the available data) and Abstracts Views on Vision4Press platform.
Data correspond to usage on the plateform after 2015. The current usage metrics is available 48-96 hours after online publication and is updated daily on week days.
Initial download of the metrics may take a while.