Fig. 1.
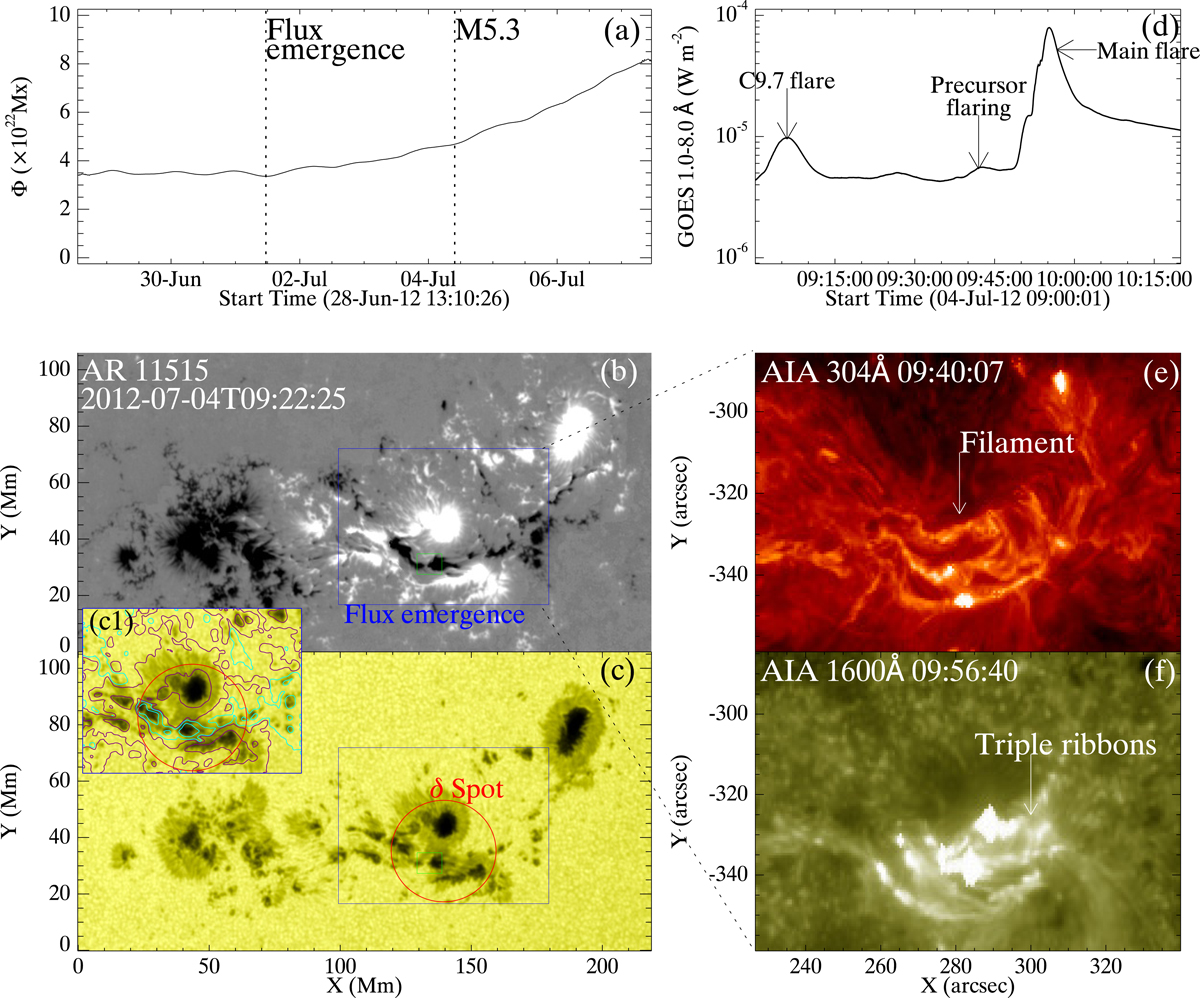
Overview of AR and the flare. (a) Temporal evolution of the unsigned magnetic flux Φ of the AR. Φ is calculated from 2012 June 28 13:00 to 2012 July 7 11:10, i.e., when the center of the AR has Stonyhurst longitude less than 60°. The two vertical-dashed lines mark the onset instants of the flux emergence and the flare. (b) Bz component of the photospheric vector magnetic field of the AR at 09:22 on 2012 July 4, with white and black colors indicating the positive and negative polarities, respective, saturating at ±1200 G. (c) Continuum image of the AR. The blue rectangle in (b) and (c) marks the field of view (FOV) of panels e, f, and Fig. 2. The green rectangle marks the FOV of Fig. 3. The continuum intensity in the blue region is further shown in the inset (c1), with contours of Bz overplotted. The contour levels are −1000, −100, 100, and 1000 Gauss, with positive (negative) values shown in purple (cyan). The red circle in (c) indicates the δ sunspot region. (d) GOES flux of the M5.3 class flare. The three arrows indicate a small C9.7-class flare, and the precursor and main phase of the M5.3-class flare. See details in Sects. 3 and 4. (e) One snapshot in the AIA 304 Å passband prior to the flare, showing the filament. (f) One snapshot in the AIA 1600 Å passband, showing multiple ribbons during the flare.
Current usage metrics show cumulative count of Article Views (full-text article views including HTML views, PDF and ePub downloads, according to the available data) and Abstracts Views on Vision4Press platform.
Data correspond to usage on the plateform after 2015. The current usage metrics is available 48-96 hours after online publication and is updated daily on week days.
Initial download of the metrics may take a while.