Fig. 2.
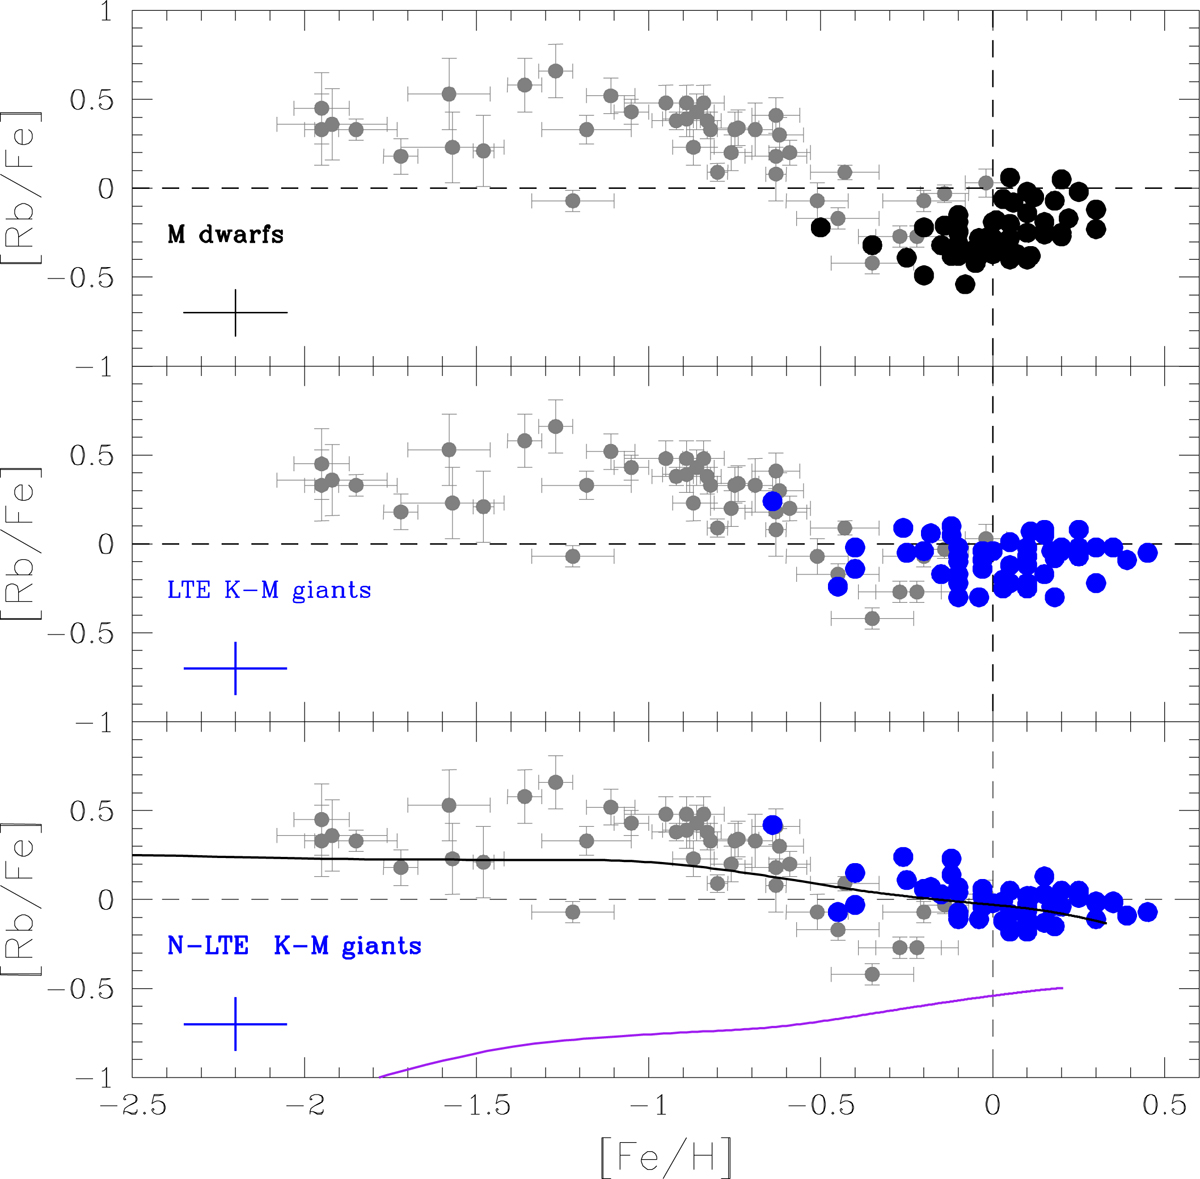
[Rb/Fe] vs. [Fe/H] diagram for M-dwarfs studied in Paper I (top panel, black dots, LTE abundances), and for KM-type giants (blue dots) in this study in LTE (middle panel) and NLTE (bottom panel). The grey dots with error bars in the three panels are the [Rb/Fe] ratios derived in halo and disc giant and dwarf stars by Gratton & Sneden (1994) and Tomkin & Lambert (1999). A typical error bar in the [Rb/Fe] ratios in Paper I and this study is shown in the bottom left corner of each panel. Upper limits in the Rb abundances are omitted in the figure. In the bottom panel, solid curves are theoretical GCE predictions by Prantzos et al. (2018, 2020): black line includes the contributions from LIMS and RM stars, and the r-process, while magenta line include only LIMS (see text for details).
Current usage metrics show cumulative count of Article Views (full-text article views including HTML views, PDF and ePub downloads, according to the available data) and Abstracts Views on Vision4Press platform.
Data correspond to usage on the plateform after 2015. The current usage metrics is available 48-96 hours after online publication and is updated daily on week days.
Initial download of the metrics may take a while.