Fig. 1.
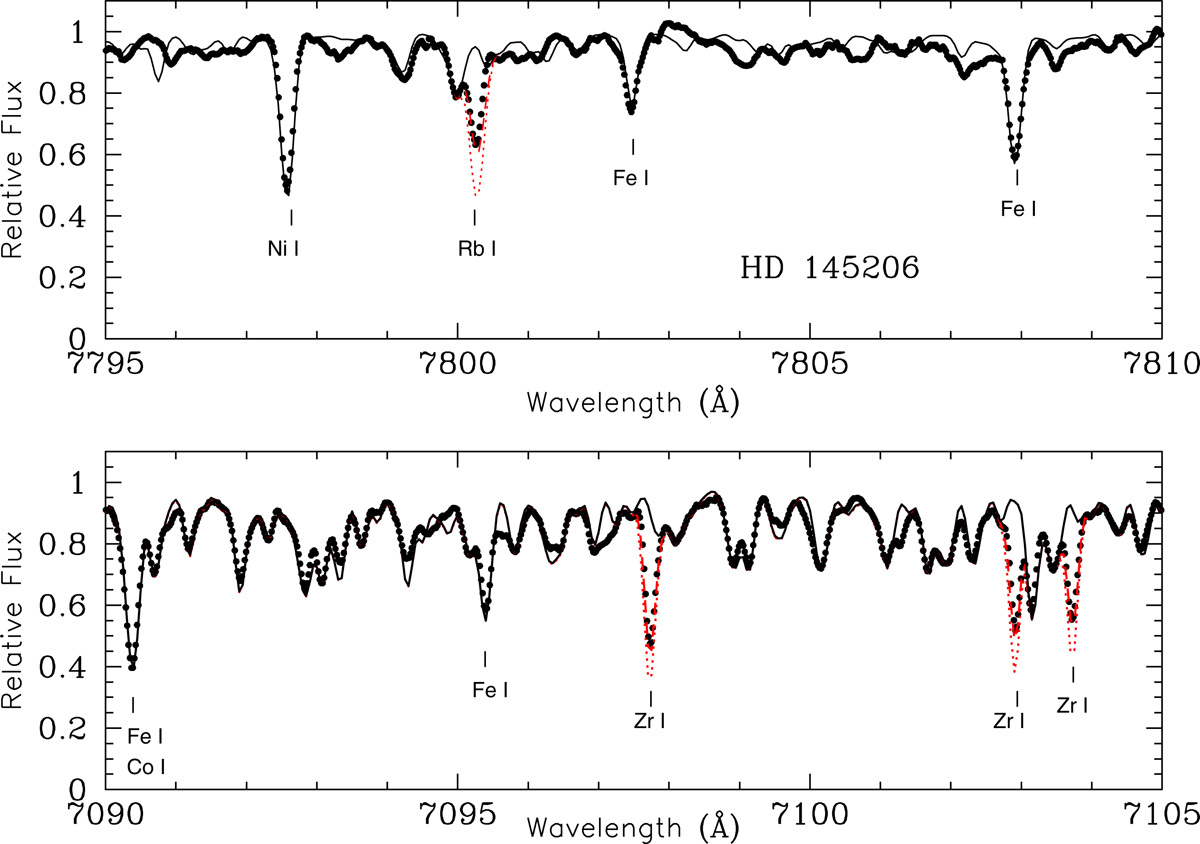
Comparison of the observed (black dots) and synthetic spectra for the M4.0 III star HD 145206 in the spectral region around λλ7800 Å (top panel) and λλ7100 Å (bottom panel). In both panels the continuous black line is a synthetic spectrum with no Rb or Zr, while red dashed and dotted lines show theoretical spectra with log ϵ(Rb) = 2.35 and 2.6 (top panel), or log ϵ(Zr) = 2.7 and 3.0 (bottom panel), respectively. Some metallic lines are marked and labelled. In the λλ7100 Å region the pseudo-continuum is reduced mainly due to the contribution of a TiO veil.
Current usage metrics show cumulative count of Article Views (full-text article views including HTML views, PDF and ePub downloads, according to the available data) and Abstracts Views on Vision4Press platform.
Data correspond to usage on the plateform after 2015. The current usage metrics is available 48-96 hours after online publication and is updated daily on week days.
Initial download of the metrics may take a while.