Fig. 2
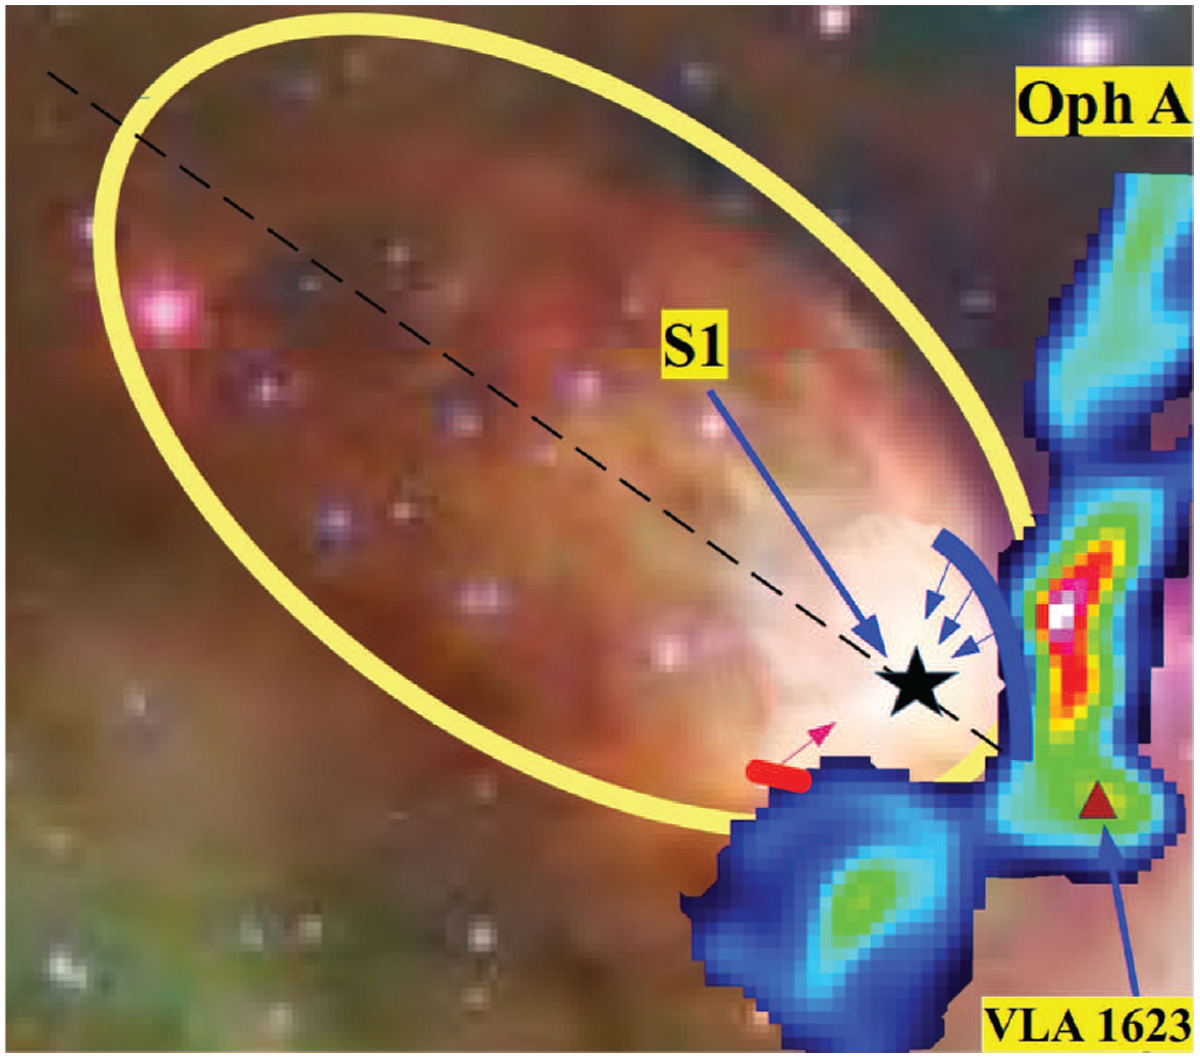
Composite-color image of the S 1 PDR derived using the 3.6, 4.5, and 8 μm Spitzer observations (Padgett et al. 2008). Also shown is a cartoon of the morphology of the PDR that is derived in this paper on the basis of the spatial and velocity dependence of emissions in multiple tracers. The red and blue surfaces show the red- and blueshifted fronts of the PDR. The color map corresponds to N2 H+ emission (Larsson & Liseau 2017) from the molecular cloud to the west. The yellow line demarcates the boundary of the PDR as identified from our [C II] observations and the 8 μm emission.
Current usage metrics show cumulative count of Article Views (full-text article views including HTML views, PDF and ePub downloads, according to the available data) and Abstracts Views on Vision4Press platform.
Data correspond to usage on the plateform after 2015. The current usage metrics is available 48-96 hours after online publication and is updated daily on week days.
Initial download of the metrics may take a while.