Fig. 9.
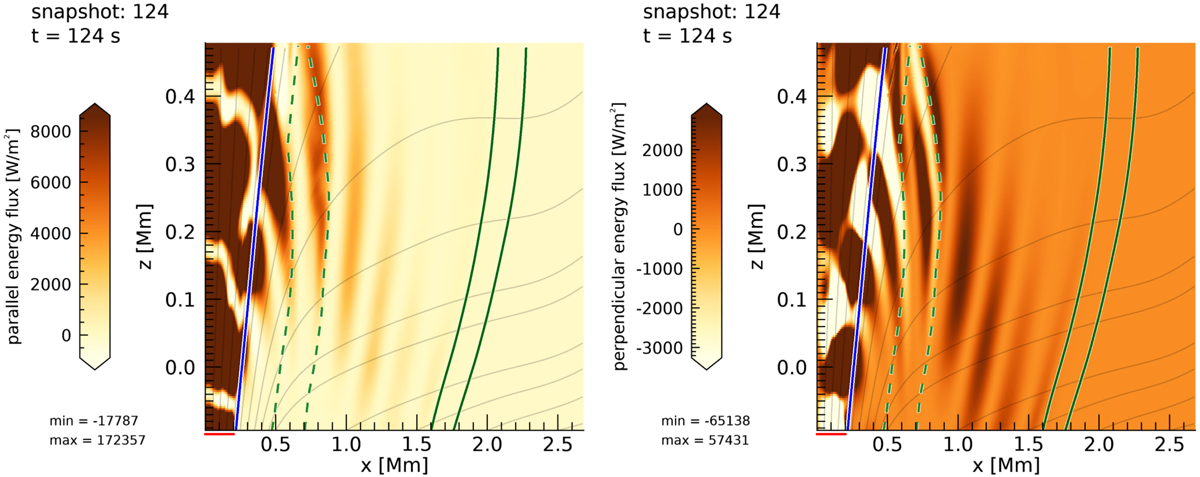
Snapshot of the wave energy flux parallel (left) and perpendicular (right) with respect to the magnetic field. The color range is saturated. The solid (dashed) green lines show the first theoretical wave fronts of the fast (slow) waves; the gray lines show the magnetic field lines. The red bars below the x-axis indicate the driver location. The blue lines highlight the field line considered for the analysis in Fig. 8. Movies of the full time sequence are available online.
Current usage metrics show cumulative count of Article Views (full-text article views including HTML views, PDF and ePub downloads, according to the available data) and Abstracts Views on Vision4Press platform.
Data correspond to usage on the plateform after 2015. The current usage metrics is available 48-96 hours after online publication and is updated daily on week days.
Initial download of the metrics may take a while.