Fig. 8.
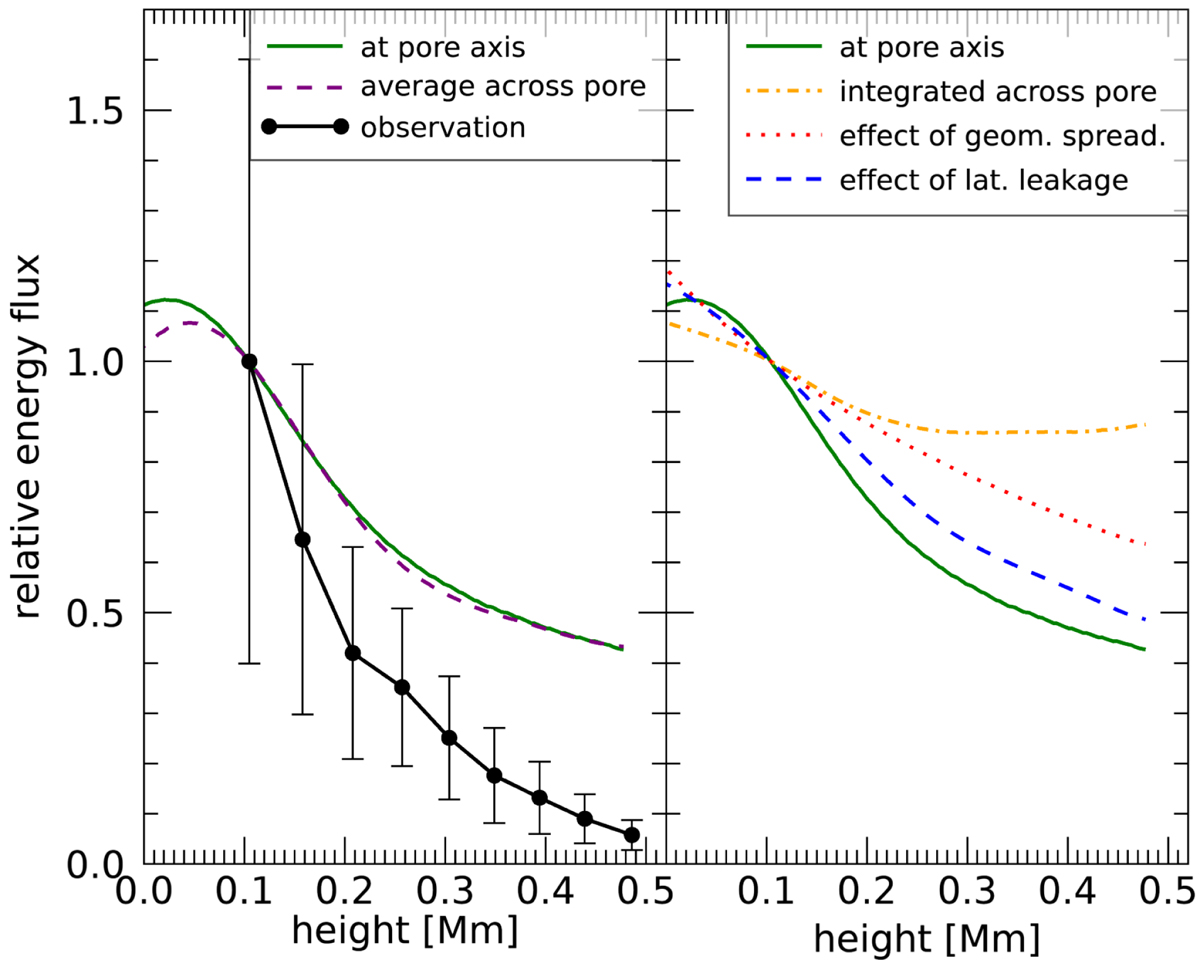
Left: relative wave energy flux parallel to the magnetic field averaged over time as a function of height for the localized driver. The solid green line shows the energy flux along the pore axis, whereas the dashed purple line shows the average flux across the pore up to the field line highlighted in Fig. 7. The observational data (black line with symbols) are from pore 3 of GM21. All fluxes are normalized to the first observational data point. Right: comparison of flux damping in the simulation with localized driver with the effects of geometric damping. The solid green line shows the same data as in the left plot for comparison. The other lines are explained in the text.
Current usage metrics show cumulative count of Article Views (full-text article views including HTML views, PDF and ePub downloads, according to the available data) and Abstracts Views on Vision4Press platform.
Data correspond to usage on the plateform after 2015. The current usage metrics is available 48-96 hours after online publication and is updated daily on week days.
Initial download of the metrics may take a while.