Fig. 2.
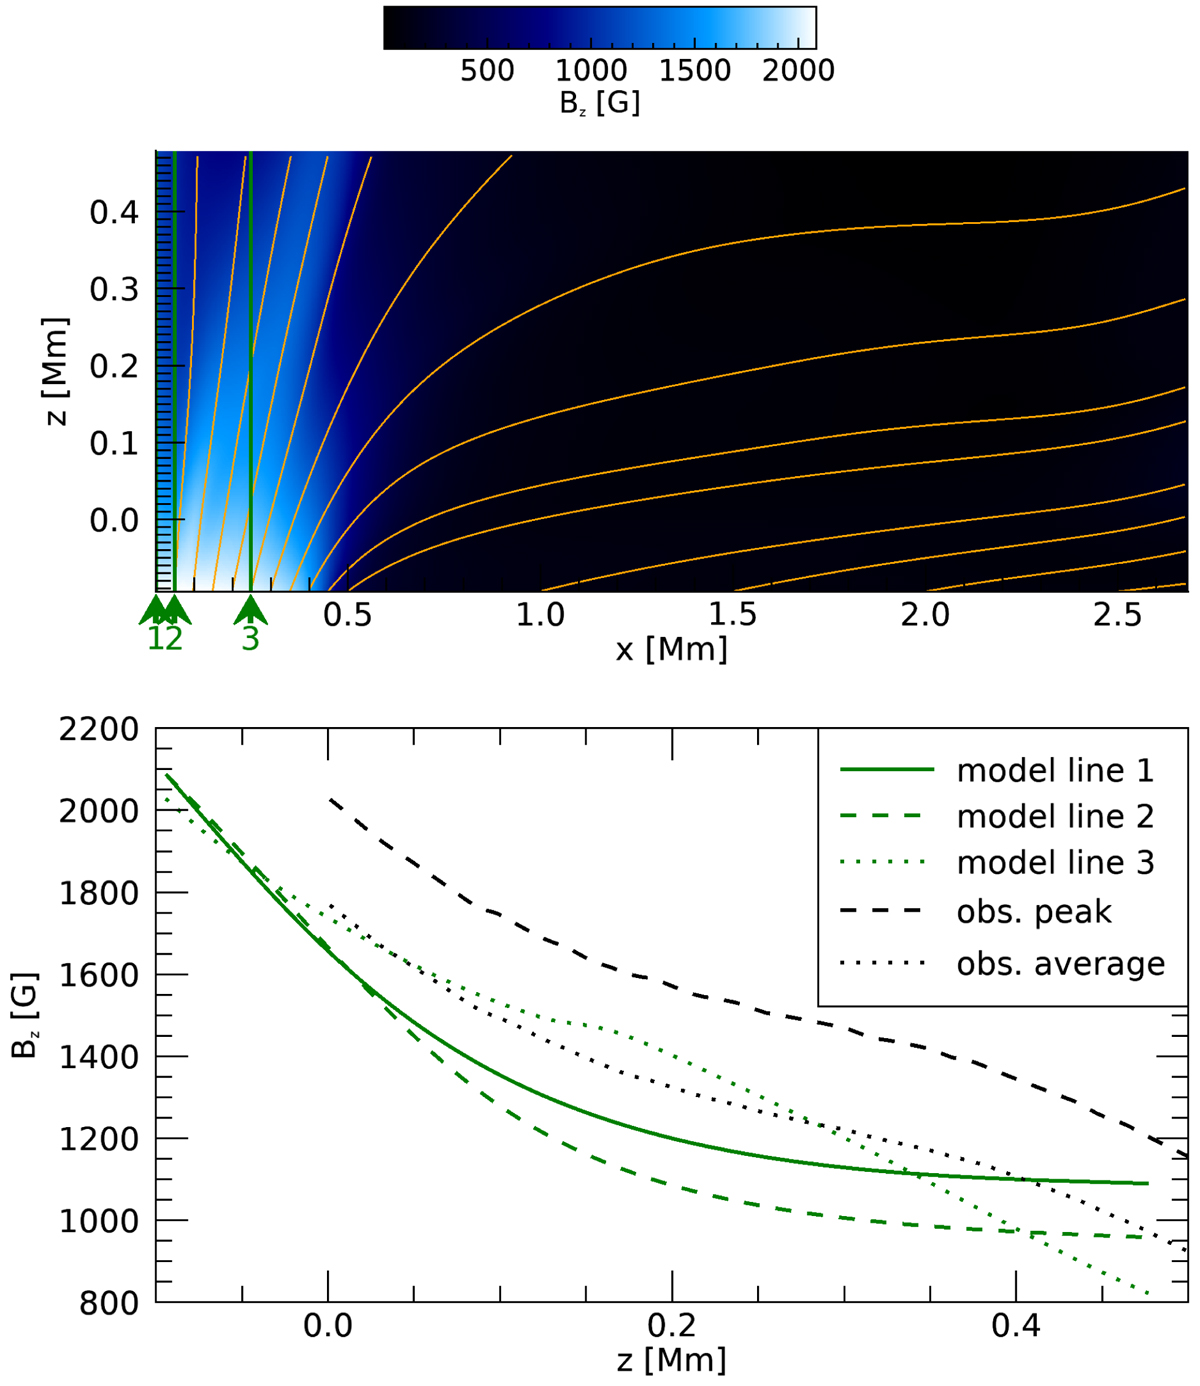
Top: vertical component of the magnetic field of the settled model atmosphere. Orange lines depict the magnetic magnetic field lines. Bottom: comparison of the model atmosphere with the observations from GM21 of pore 3. The maximum observational value within the pore is shown by obs. peak, while the horizontal average across the whole pore is shown by obs. average. The green lines show the model values for the indicated lines in the top figure (line 1 at pore axis).
Current usage metrics show cumulative count of Article Views (full-text article views including HTML views, PDF and ePub downloads, according to the available data) and Abstracts Views on Vision4Press platform.
Data correspond to usage on the plateform after 2015. The current usage metrics is available 48-96 hours after online publication and is updated daily on week days.
Initial download of the metrics may take a while.