Fig. A.1.
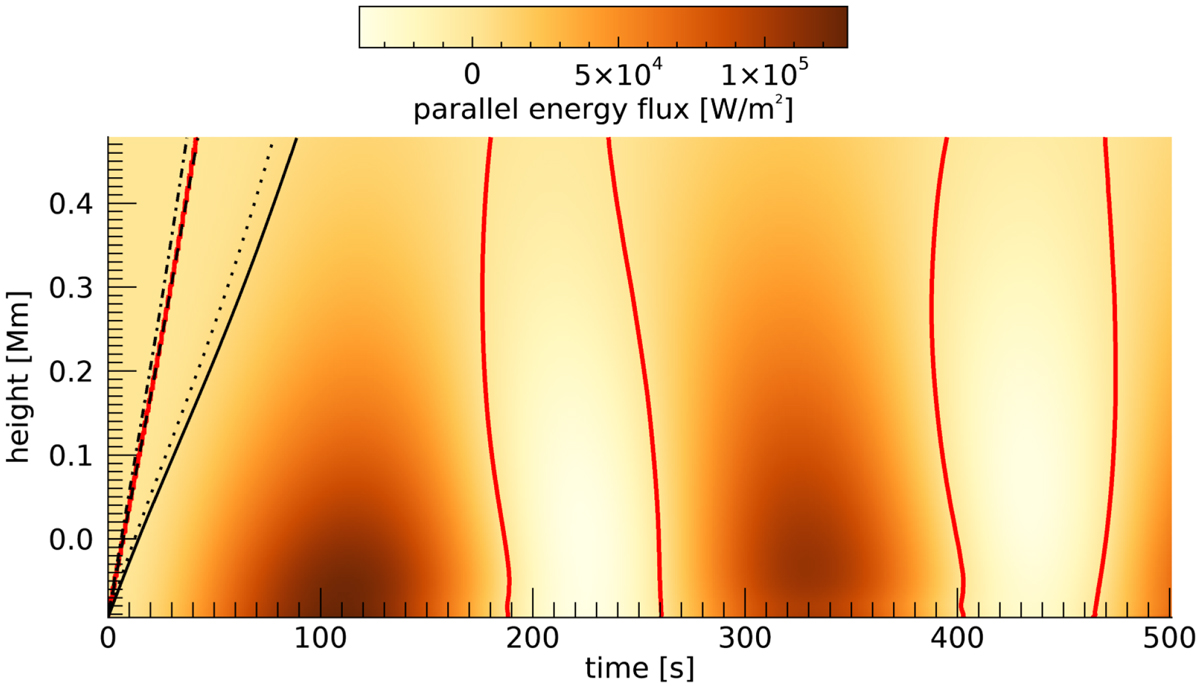
Parallel wave energy flux as a function of height and time at the pore axis for the simulation with localized driver with a period of 7 min. The black lines show (from steepest to flattest) the fast speed (dash-dotted line), sound speed (dashed line), Alfvén speed (dotted line), and cusp speed (solid line). The red lines show the contours for zero flux. The frequency of the energy flux is approximately doubled compared to the driver period because of phase difference between p′ and v′ (see Eq. (11)).
Current usage metrics show cumulative count of Article Views (full-text article views including HTML views, PDF and ePub downloads, according to the available data) and Abstracts Views on Vision4Press platform.
Data correspond to usage on the plateform after 2015. The current usage metrics is available 48-96 hours after online publication and is updated daily on week days.
Initial download of the metrics may take a while.