Free Access
Fig. 10.
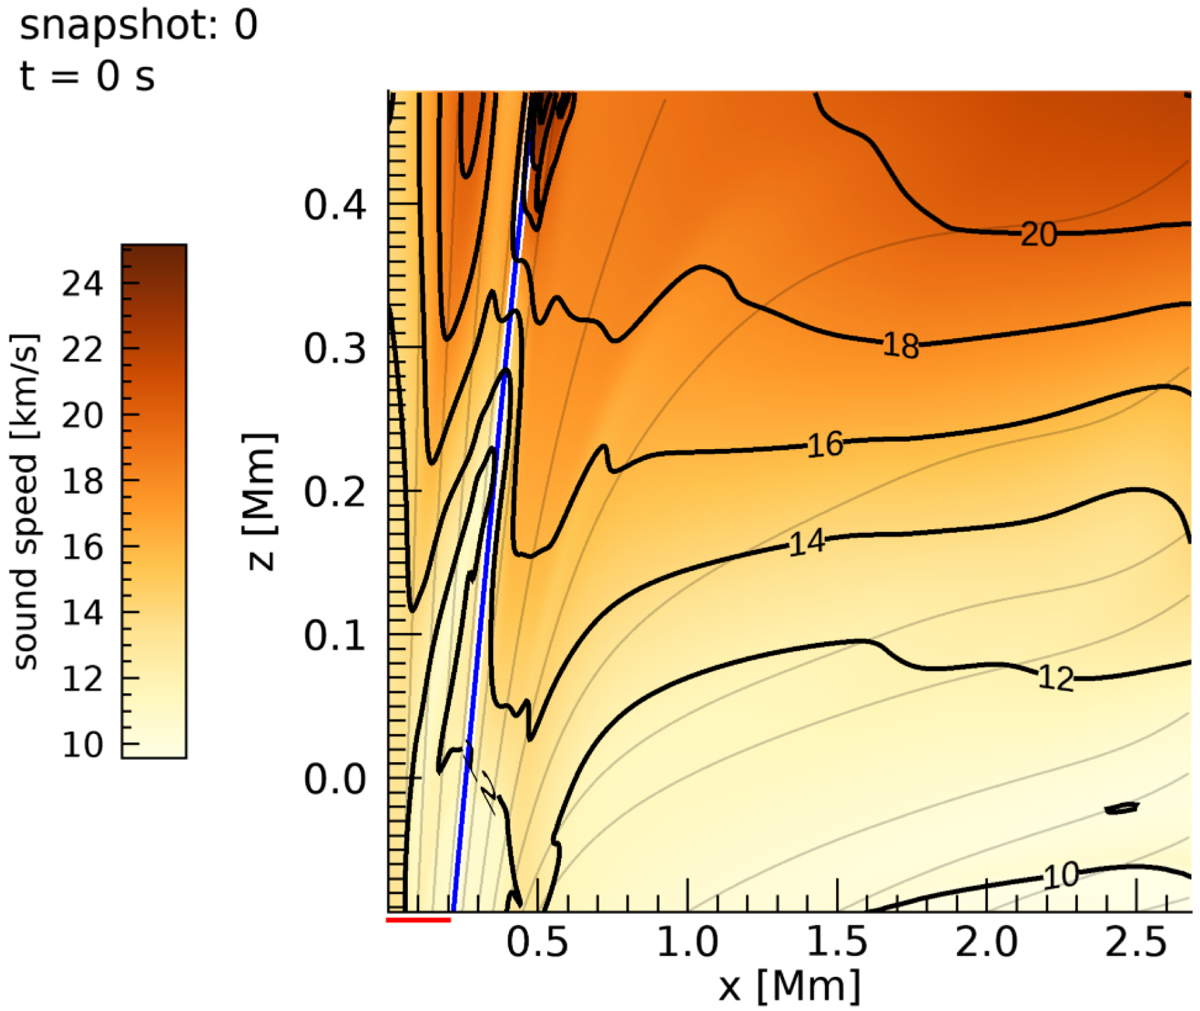
Sound speed of the initial atmosphere. Gray lines show magnetic field lines. The red bar below the x-axis indicates the driver location for simulations with localized driver. The blue line highlights the field line considered for the analysis in Fig. 8. Contours for the sound speed are shown in thick black lines.
Current usage metrics show cumulative count of Article Views (full-text article views including HTML views, PDF and ePub downloads, according to the available data) and Abstracts Views on Vision4Press platform.
Data correspond to usage on the plateform after 2015. The current usage metrics is available 48-96 hours after online publication and is updated daily on week days.
Initial download of the metrics may take a while.